HMBA Basal Ganglia: Neuroglancer Views#
Neuroglancer Views – Coordinate Spaces#
Click thumbnails to launch Neuroglancer for each coordinate space.
Species |
Donor |
Slab |
Donor |
CCF |
HiP-CT |
|---|---|---|---|---|---|
Human |
H22.30.001 |
|
— |
|

|
Macaque |
QM23.50.001 (Red) |
|
ETA 2026 |
ETA 2026 |
TBD |
Marmoset |
CJ23.56.004 (Tank) |
|
ETA 2026 |
ETA 2026 |
TBD |
The cell coordinates are registered to four different reference spaces, each serving a distinct purpose.
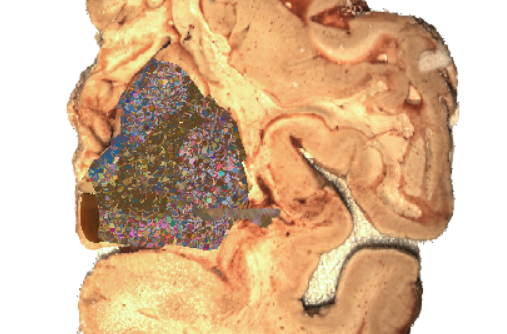
Slab#
The coordinate system of the slab-face images that each spatial transcriptomics plane belongs to.
This view shows cells in the context of the imaging assets used for mosaicking (e.g., block-face and slab-face images).
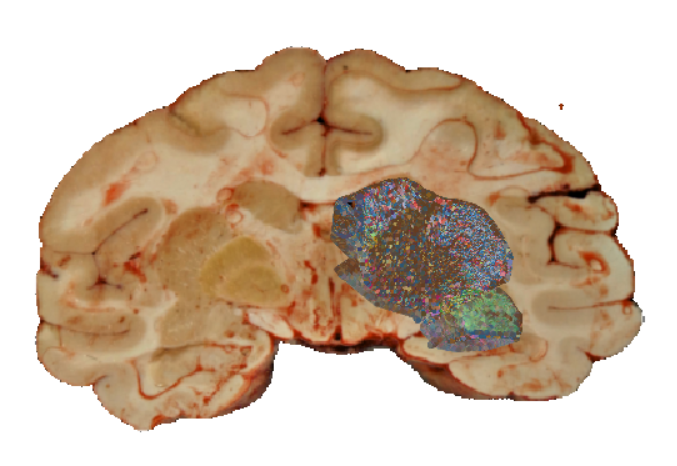
Donor#
The native MRI space corresponding to the individual donor from whom the spatial transcriptomics sections were sampled.
This view preserves subject-specific anatomy before normalization to any common template.
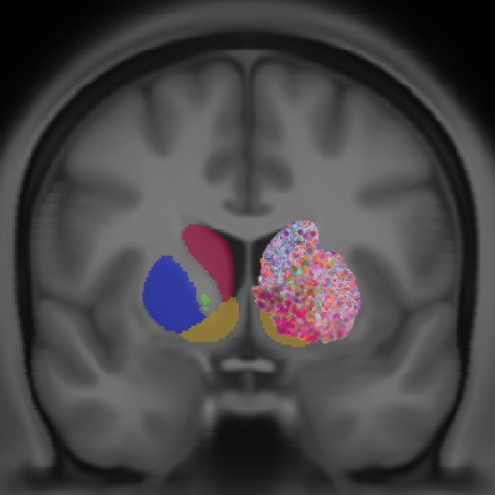
CCF (Common Coordinate Framework)#
The standardized reference space for the donor’s species, enabling cross-donor and cross-dataset comparisons.
See this link for more details.
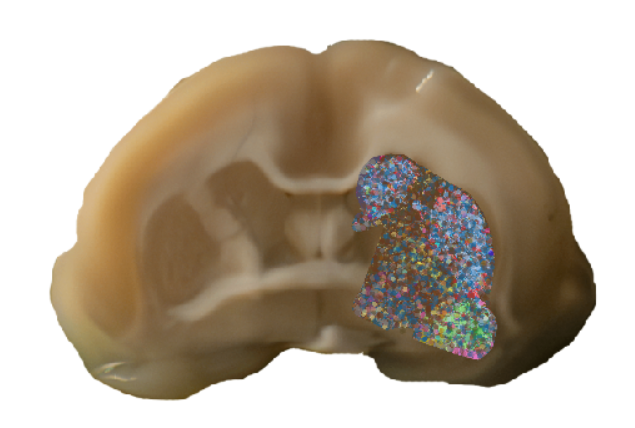
HiP-CT (Cellular-Resolution Volumetric Scan)#
A cellular-resolution (25 µm) volumetric scan of the human brain.
Details about the HiP-CT dataset and donor.
Note: The spatial transcriptomics data were not sampled from the same donor; alignment is used only for anatomical correspondence.
Quick Guide#
Click a section title to expand/collapse.
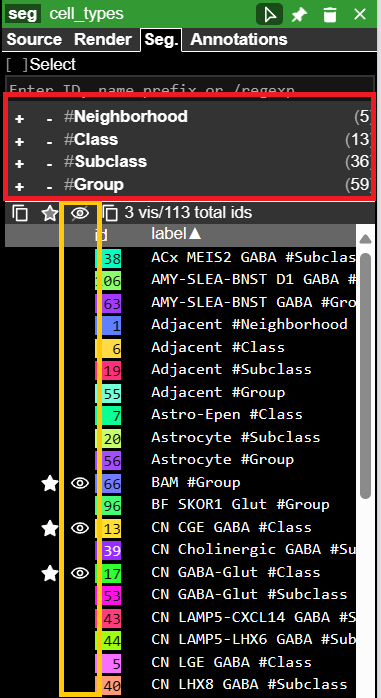
1 · Filter annotations by cell types
From the right pane, pick taxonomic cell types to show or hide (yellow box).
To filter by taxonomic level, click the + or − buttons next to each taxonomic level (red box).
If the right panel is not visible, right-click the cell_types tab on the top left.
In that panel, select the seg tab.
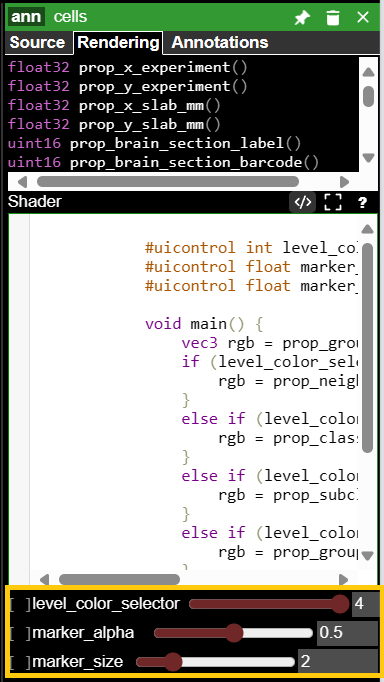
2 · Color annotations by taxonomic level – set annotation size & opacity
Select the cells tab from the top left, then choose the rendering tab in the right pane.
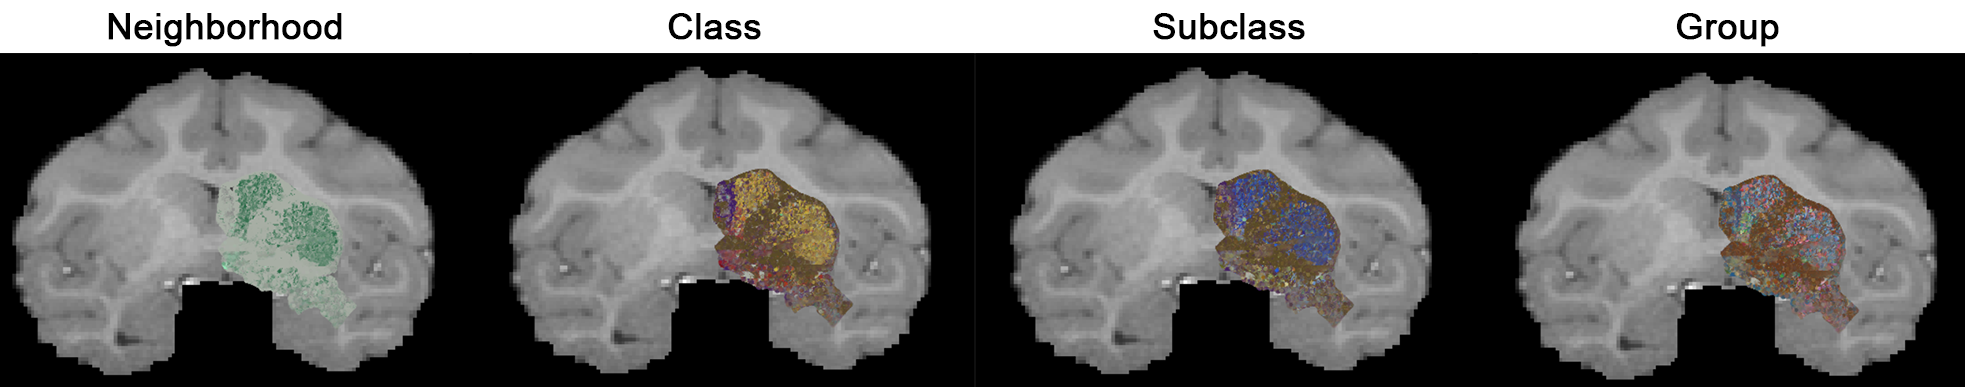
Choose a taxonomic level for coloring with the level_color_selector:
• 1: Neighborhood
• 2: Class
• 3: Subclass
• 4: Group (default)
Adjust annotation size and opacity.
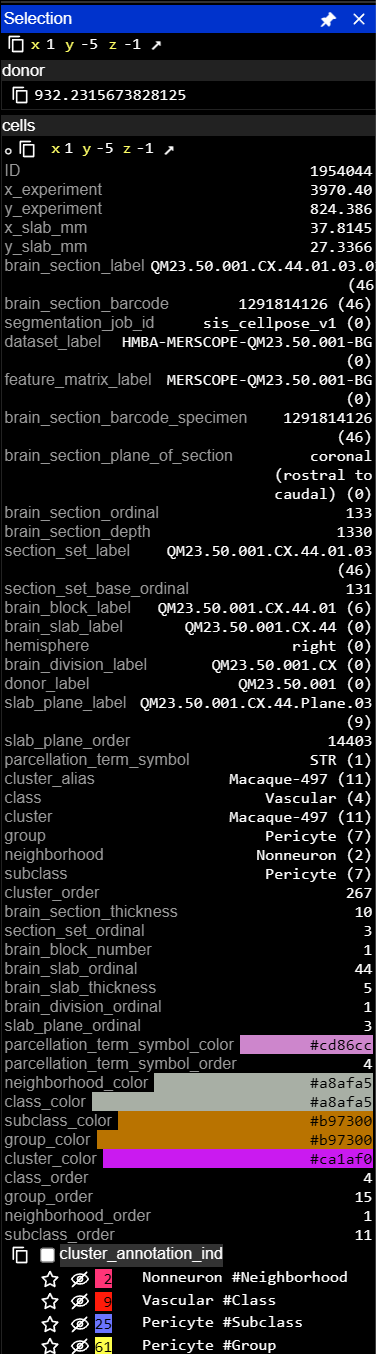
3 · View annotation metadata
To see metadata for an annotation:
Click the hamburger icon (third icon) from the top right to toggle Selection Details Panel.
Mouse over an annotation to view its metadata from the right panel.
4 · Align view with cell sections by tilting cross-section plane
Tilting the cross-section plane helps match views to cell section planes.
Click inside a view (coronal, transverse, sagittal) to focus it.
Rotate with keys: e (left) and r (right).
Or hold Shift and drag with the mouse to tilt across all axes.
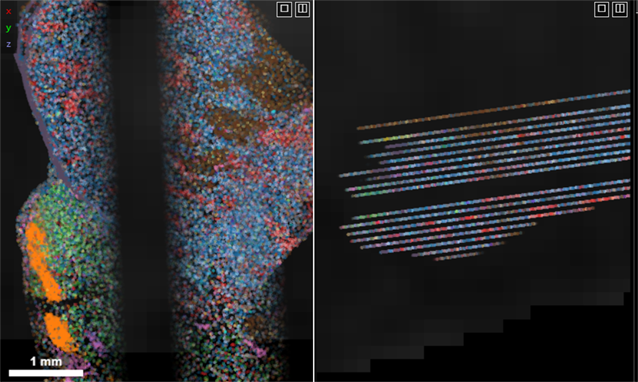
Before tilting
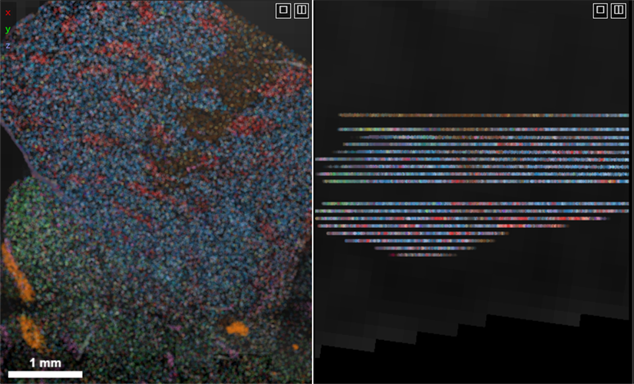
After tilting
5 · Increase annotation view depth
If only a partial coronal cell-section plane is visible, increase the annotation view depth.
Shortcut: Hold Alt and use the mouse wheel.