Allen Mouse Common Coordinate Framework (2020 version)#
Allen Mouse Brain Common Coordinate Framework (CCFv3, Wang et al, 2020) is a 3D reference space is an average brain at 10um voxel resolution created from serial two-photon tomography images of 1,675 young adult C57Bl6/J mice. Using multimodal reference data, the entire brain parcellated directly in 3D, labeling every voxel with a brain structure spanning 43 isocortical areas and their layers, 314 subcortical gray matter structures, 81 fiber tracts, and 8 ventricular structures. The 2020 version adds new annotations for layers of the Ammon’s horn (CA), main olfactory bulb (MOB) and minor modification of surrounding fiber tracts.
CCFv3 is used in informatics pipelines and online applications to analyze, visualize and integrate multimodal and multiscale data sets in 3D, and is openly accessible for research use.
The purpose of this notebook is to provide an overview of the data assets and information associated with the Allen CCFv3 through example use cases.
You need to be connected to the internet to run this notebook and have run through the getting started notebook.
import pandas as pd
import numpy as np
import matplotlib.pyplot as plt
import requests
import SimpleITK as sitk
from pathlib import Path

from abc_atlas_access.abc_atlas_cache.abc_project_cache import AbcProjectCache
We will interact with the data using the AbcProjectCache. This cache object tracks which data has been downloaded and serves the path to the requsted data on disk. For metadata, the cache can also directly serve a up a Pandas Dataframe. See the getting_started notebook for more details on using the cache including installing it if it has not already been.
Change the download_base variable to where you have downloaded the data in your system.
download_base = Path('../../data/abc_atlas')
abc_cache = AbcProjectCache.from_cache_dir(download_base)

abc_cache.current_manifest
'releases/20250531/manifest.json'
Data Overview#
Reference template and parcellations#
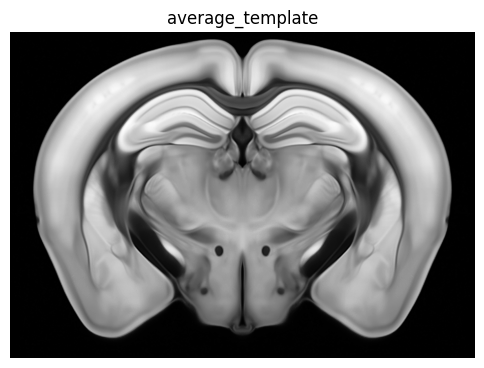
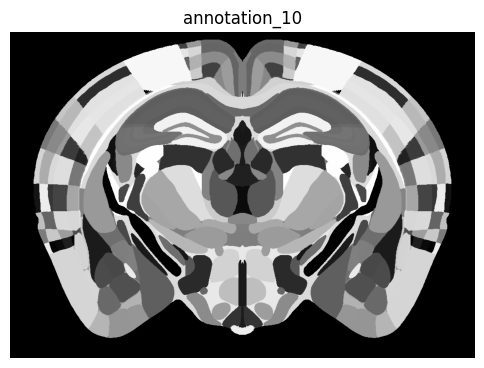
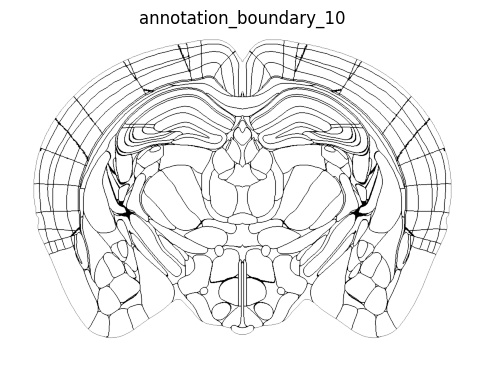
There are 3 volumetric data files associated with AllenCCFv3. The “average_template_10” volume is the anatomical template of the CCF constructed as the shape and intensity average of 1675 specime brains. The “annotation_10” volume is the parcellation of the brain with respect to a heirachical partonomy of anatomical structures. The “annotation_boundary_10” volume is a mask that identifies all the voxel with on the boundary of a parcellation to support data visualization. The volumes are stored in compressed NIFTI (.nii.gz) format. In this notebook uses the SimpleITK library to open the volume.
abc_cache.list_image_volume_files('Allen-CCF-2020')
['annotation_10',
 'annotation_25',
 'annotation_boundary_10',
 'annotation_boundary_25',
 'average_template_10',
 'average_template_25']
file = abc_cache.get_file_path(directory='Allen-CCF-2020', file_name='average_template_10')
average_template_image = sitk.ReadImage(file)
average_template_array = sitk.GetArrayViewFromImage(average_template_image)

file = abc_cache.get_file_path(directory='Allen-CCF-2020', file_name='annotation_10')
annotation_image = sitk.ReadImage(file)
annotation_array = sitk.GetArrayViewFromImage(annotation_image)

file = abc_cache.get_file_path(directory='Allen-CCF-2020', file_name='annotation_boundary_10')
annotation_boundary_image = sitk.ReadImage(file)
annotation_boundary_array = sitk.GetArrayViewFromImage(annotation_boundary_image)
We define a helper function to print out some basic metadata about a volume
# Function to print out image information
def image_info(img):
    print(f'size: {img.GetSize()} voxels')
    print(f'spacing: {img.GetSpacing()} mm')
    print(f'direction: {img.GetDirection()}')
    print(f'origin: {img.GetOrigin()}')
Each volume is of size 1320 x 800 x 1140 voxels with voxel dimension being 10 x 10 x 10 micrometers. The volume is ASL orientation such that first (x) axis is anterior-to-posterior, the second (y) axis is superior-to-inferior (dorsal-to-ventral) and third (z) axis is left-to-right.
image_info(average_template_image)
size: (1320, 800, 1140) voxels
spacing: (0.009999999776482582, 0.009999999776482582, 0.009999999776482582) mm
direction: (-0.0, 0.0, -1.0, 1.0, -0.0, 0.0, 0.0, -1.0, 0.0)
origin: (5.695000171661377, -5.349999904632568, 5.21999979019165)
spacing = average_template_image.GetSpacing()
voxel_volume = spacing[0] * spacing[1] * spacing[2]
print("voxel volume in mm^3:", "%0.2E" % voxel_volume)
voxel volume in mm^3: 1.00E-06
We define a helper function to visualize the sanme coronal section of the average template, annotation and boundary volumes
def plot_section(slice, cmap = plt.cm.Greys_r, fig_width = 6, fig_height = 6):
    fig, ax = plt.subplots()
    fig.set_size_inches(fig_width, fig_height)
    if cmap is not None:
        plt.imshow(slice, cmap=cmap)
    else :
        plt.imshow(slice)
    plt.axis("off")
    return fig, ax
zindex = 720
zslice = np.transpose(average_template_array[:, :, zindex])
fig, ax = plot_section(zslice)
res = ax.set_title('average_template')
plt.show()
zslice = np.transpose(annotation_array[:, :, zindex])
fig, ax = plot_section(zslice)
res = ax.set_title('annotation_10')
plt.show()
zslice = np.transpose(annotation_boundary_array[:, :, zindex])
fig, ax = plot_section(zslice, cmap=plt.cm.Greys)
res = ax.set_title('annotation_boundary_10')
plt.show()
Anatomical structures and parcellation annotation#
Parcellations#
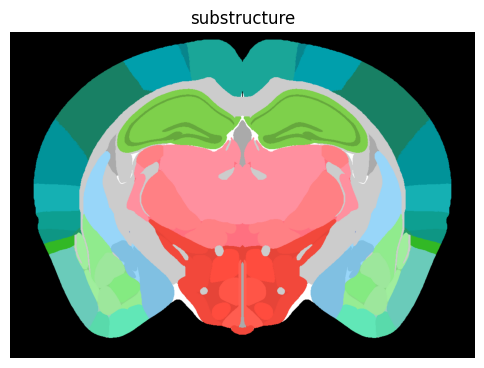
The annotation volume represents tiling of set of parcellations. Each row of the parcellation dataframe has a label (human readable string that is unique in the database), a parcellation index representing the value in the annotation volume and the number of voxel and volume of that parcellation.
parcellation = abc_cache.get_metadata_dataframe(directory='Allen-CCF-2020', file_name='parcellation')
parcellation.set_index('parcellation_index', inplace=True)
print("number of parcellations:", len(parcellation))
parcellation
number of parcellations: 688
| label | voxel_count | volume_mm3 | |
|---|---|---|---|
| parcellation_index | |||
| 987 | AllenCCF-Annotation-2020-997 | 3564320 | 3.564320 |
| 63 | AllenCCF-Annotation-2020-68 | 256520 | 0.256520 |
| 657 | AllenCCF-Annotation-2020-667 | 232608 | 0.232608 |
| 1288 | AllenCCF-Annotation-2020-526157192 | 371584 | 0.371584 |
| 1289 | AllenCCF-Annotation-2020-526157196 | 112222 | 0.112222 |
| ... | ... | ... | ... |
| 135 | AllenCCF-Annotation-2020-140 | 405256 | 0.405256 |
| 140 | AllenCCF-Annotation-2020-145 | 499566 | 0.499566 |
| 148 | AllenCCF-Annotation-2020-153 | 461680 | 0.461680 |
| 159 | AllenCCF-Annotation-2020-164 | 432 | 0.000432 |
| 0 | AllenCCF-Annotation-2020-0 | 697783214 | 697.783214 |
688 rows × 3 columns
Parcellation term sets#
For the purpose of ABC atlas visualization and analysis, we have created a simplifed 5 level anatomical heirarchy. Each of these level is represented as a parcellation term set. Each term set consists of a set of ordered terms. Each term set has a label (human readable string that is unique in the database), a name, description and order among the term sets.
parcellation_term_set = abc_cache.get_metadata_dataframe(directory='Allen-CCF-2020', file_name='parcellation_term_set')
parcellation_term_set.set_index('label', inplace=True)
print("number of term sets:", len(parcellation_term_set))
parcellation_term_set
number of term sets: 5
| description | name | parcellation_terminology_label | term_set_order | parent_term_set_label | |
|---|---|---|---|---|---|
| label | |||||
| AllenCCF-Ontology-2017-ORGA | organ | organ | AllenCCF-Ontology-2017 | 0 | NaN |
| AllenCCF-Ontology-2017-CATE | mouse brain anatomical catergories | category | AllenCCF-Ontology-2017 | 1 | AllenCCF-Ontology-2017-ORGA |
| AllenCCF-Ontology-2017-DIVI | mouse brain divisions | division | AllenCCF-Ontology-2017 | 2 | AllenCCF-Ontology-2017-CATE |
| AllenCCF-Ontology-2017-STRU | mouse brain structures | structure | AllenCCF-Ontology-2017 | 3 | AllenCCF-Ontology-2017-DIVI |
| AllenCCF-Ontology-2017-SUBS | mouse brain substructures | substructure | AllenCCF-Ontology-2017 | 4 | AllenCCF-Ontology-2017-STRU |
Parcellation terms and term set membership#
A parcellation term represents an anatomical structure at a single heirarchy level. Each term has a label (human readable string that is unique in the database), a name, acronym, reference atlas color as hex triplet or as RGB values.
parcellation_term = abc_cache.get_metadata_dataframe(directory='Allen-CCF-2020', file_name='parcellation_term')
parcellation_term.set_index('label', inplace=True)
print("number of terms:", len(parcellation_term))
parcellation_term.head(5)
number of terms: 1631
| acronym | name | color_hex_triplet | graph_order | identifier | red | green | blue | parent_identifier | |
|---|---|---|---|---|---|---|---|---|---|
| label | |||||||||
| AllenCCF-Ontology-2017-997 | brain | brain | #FFFFFF | 0.0 | MBA:997 | 255 | 255 | 255 | NaN |
| AllenCCF-Ontology-2017-8 | grey | Basic cell groups and regions | #BFDAE3 | 1.0 | MBA:8 | 191 | 218 | 227 | MBA:997 |
| AllenCCF-Ontology-2017-567 | CH | Cerebrum | #B0F0FF | 2.0 | MBA:567 | 176 | 240 | 255 | MBA:8 |
| AllenCCF-Ontology-2017-688 | CTX | Cerebral cortex | #B0FFB8 | 3.0 | MBA:688 | 176 | 255 | 184 | MBA:567 |
| AllenCCF-Ontology-2017-695 | CTXpl | Cortical plate | #70FF70 | 4.0 | MBA:695 | 112 | 255 | 112 | MBA:688 |
A parcellation is a member of at most one parcellation term set. This membership is represented as a row in the parcellation term set memership dataframe.
parcellation_term_set_membership = abc_cache.get_metadata_dataframe(directory='Allen-CCF-2020',
                                                                    file_name='parcellation_term_set_membership')
print("number of memberships:", len(parcellation_term_set_membership))
parcellation_term_set_membership.head(5)
number of memberships: 1293
| parcellation_term_label | parcellation_term_set_label | parent_term_label | term_order | |
|---|---|---|---|---|
| 0 | AllenCCF-Ontology-2017-997 | AllenCCF-Ontology-2017-ORGA | NaN | 0 |
| 1 | AllenCCF-Ontology-2017-8 | AllenCCF-Ontology-2017-CATE | AllenCCF-Ontology-2017-997 | 1 |
| 2 | AllenCCF-Ontology-2017-1009 | AllenCCF-Ontology-2017-CATE | AllenCCF-Ontology-2017-997 | 2 |
| 3 | AllenCCF-Ontology-2017-73 | AllenCCF-Ontology-2017-CATE | AllenCCF-Ontology-2017-997 | 3 |
| 4 | AllenCCF-Ontology-2017-315 | AllenCCF-Ontology-2017-DIVI | AllenCCF-Ontology-2017-8 | 1 |
Parcellation to parcellation term membership#
The association between a parcellation and parcellation term is represented as “parcellation to parcellation term membership” within the context of anatomical structure level. It is expected that a parcellation in only associated with one term within a specific term set.
parcellation_annotation = abc_cache.get_metadata_dataframe(directory='Allen-CCF-2020',
                                                           file_name='parcellation_to_parcellation_term_membership')
print("number of memberships:", len(parcellation_annotation))
parcellation_annotation
number of memberships: 3440
| parcellation_label | parcellation_term_label | parcellation_term_set_label | parcellation_index | voxel_count | volume_mm3 | color_hex_triplet | red | green | blue | parcellation_term_name | parcellation_term_acronym | parcellation_term_set_name | term_set_order | term_order | parent_term_label | |
|---|---|---|---|---|---|---|---|---|---|---|---|---|---|---|---|---|
| 0 | AllenCCF-Annotation-2020-997 | AllenCCF-Ontology-2017-997 | AllenCCF-Ontology-2017-ORGA | 987 | 3564320 | 3.564320 | #FFFFFF | 255 | 255 | 255 | brain | brain | organ | 0 | 0 | NaN |
| 1 | AllenCCF-Annotation-2020-68 | AllenCCF-Ontology-2017-997 | AllenCCF-Ontology-2017-ORGA | 63 | 256520 | 0.256520 | #FFFFFF | 255 | 255 | 255 | brain | brain | organ | 0 | 0 | NaN |
| 2 | AllenCCF-Annotation-2020-68 | AllenCCF-Ontology-2017-8 | AllenCCF-Ontology-2017-CATE | 63 | 256520 | 0.256520 | #BFDAE3 | 191 | 218 | 227 | Basic cell groups and regions | grey | category | 1 | 1 | AllenCCF-Ontology-2017-997 |
| 3 | AllenCCF-Annotation-2020-68 | AllenCCF-Ontology-2017-315 | AllenCCF-Ontology-2017-DIVI | 63 | 256520 | 0.256520 | #70FF71 | 112 | 255 | 113 | Isocortex | Isocortex | division | 2 | 1 | AllenCCF-Ontology-2017-8 |
| 4 | AllenCCF-Annotation-2020-68 | AllenCCF-Ontology-2017-184 | AllenCCF-Ontology-2017-STRU | 63 | 256520 | 0.256520 | #268F45 | 38 | 143 | 69 | Frontal pole, cerebral cortex | FRP | structure | 3 | 1 | AllenCCF-Ontology-2017-315 |
| ... | ... | ... | ... | ... | ... | ... | ... | ... | ... | ... | ... | ... | ... | ... | ... | ... |
| 3435 | AllenCCF-Annotation-2020-145 | ABC-Ontology-2023-V4-structure | AllenCCF-Ontology-2017-STRU | 140 | 499566 | 0.499566 | #AAAAAA | 170 | 170 | 170 | fourth ventricle, unassigned | V4-unassigned | structure | 3 | 367 | AllenCCF-Ontology-2017-145 |
| 3436 | AllenCCF-Annotation-2020-145 | ABC-Ontology-2023-V4-substructure | AllenCCF-Ontology-2017-SUBS | 140 | 499566 | 0.499566 | #AAAAAA | 170 | 170 | 170 | fourth ventricle, unassigned | V4-unassigned | substructure | 4 | 885 | ABC-Ontology-2023-V4-structure |
| 3437 | AllenCCF-Annotation-2020-153 | ABC-Ontology-2023-V4r-substructure | AllenCCF-Ontology-2017-SUBS | 148 | 461680 | 0.461680 | #AAAAAA | 170 | 170 | 170 | lateral recess | V4r | substructure | 4 | 886 | AllenCCF-Ontology-2017-153 |
| 3438 | AllenCCF-Annotation-2020-164 | ABC-Ontology-2023-c-structure | AllenCCF-Ontology-2017-STRU | 159 | 432 | 0.000432 | #AAAAAA | 170 | 170 | 170 | central canal, spinal cord/medulla | c | structure | 3 | 369 | AllenCCF-Ontology-2017-164 |
| 3439 | AllenCCF-Annotation-2020-164 | ABC-Ontology-2023-c-substructure | AllenCCF-Ontology-2017-SUBS | 159 | 432 | 0.000432 | #AAAAAA | 170 | 170 | 170 | central canal, spinal cord/medulla | c | substructure | 4 | 887 | ABC-Ontology-2023-c-structure |
3440 rows × 16 columns
Example use cases#
Aggregate parcellations and voxels per term#
We can obtain parcellation and voxel count per parcellation annotation term using the pandas groupby function
# Count the number of parcellation associated with each parcellation term
term_parcellation_count = parcellation_annotation.groupby(['parcellation_term_label'])[['parcellation_index']].count()
term_parcellation_count.columns = ['number_of_parcellations']
term_parcellation_count.sort_values('number_of_parcellations', inplace=True, ascending=False)
term_parcellation_count
| number_of_parcellations | |
|---|---|
| parcellation_term_label | |
| AllenCCF-Ontology-2017-997 | 687 |
| AllenCCF-Ontology-2017-8 | 597 |
| AllenCCF-Ontology-2017-315 | 241 |
| AllenCCF-Ontology-2017-1009 | 81 |
| AllenCCF-Ontology-2017-313 | 59 |
| ... | ... |
| AllenCCF-Ontology-2017-10703 | 1 |
| AllenCCF-Ontology-2017-10704 | 1 |
| AllenCCF-Ontology-2017-1072 | 1 |
| AllenCCF-Ontology-2017-1074 | 1 |
| AllenCCF-Ontology-2017-998 | 1 |
1072 rows × 1 columns
# Count the number of voxels associated with each parcellation term
term_voxel_count = parcellation_annotation.groupby(['parcellation_term_label'])[['voxel_count','volume_mm3']].sum()
term_voxel_count.sort_values('voxel_count', inplace=True, ascending=False)
term_voxel_count
| voxel_count | volume_mm3 | |
|---|---|---|
| parcellation_term_label | ||
| ABC-Ontology-2023-unassigned-substructure | 697783214 | 697.783214 |
| ABC-Ontology-2023-unassigned-structure | 697783214 | 697.783214 |
| ABC-Ontology-2023-unassigned-organ | 697783214 | 697.783214 |
| ABC-Ontology-2023-unassigned-division | 697783214 | 697.783214 |
| ABC-Ontology-2023-unassigned-category | 697783214 | 697.783214 |
| ... | ... | ... |
| ABC-Ontology-2023-c-structure | 432 | 0.000432 |
| ABC-Ontology-2023-CA1-substructure | 6 | 0.000006 |
| AllenCCF-Ontology-2017-1051 | 4 | 0.000004 |
| ABC-Ontology-2023-CA3-substructure | 2 | 0.000002 |
| AllenCCF-Ontology-2017-545 | 2 | 0.000002 |
1072 rows × 2 columns
# Join counts with the term dataframe
term_with_counts = parcellation_term.join(term_parcellation_count['number_of_parcellations'], how='inner')
term_with_counts.index.name = 'label'
term_with_counts = term_with_counts.join(term_voxel_count[['voxel_count','volume_mm3']])
term_with_counts[['name', 'number_of_parcellations', 'voxel_count', 'volume_mm3']]
term_with_counts.head(5)
| acronym | name | color_hex_triplet | graph_order | identifier | red | green | blue | parent_identifier | number_of_parcellations | voxel_count | volume_mm3 | |
|---|---|---|---|---|---|---|---|---|---|---|---|---|
| label | ||||||||||||
| AllenCCF-Ontology-2017-997 | brain | brain | #FFFFFF | 0.0 | MBA:997 | 255 | 255 | 255 | NaN | 687 | 506056786 | 506.056786 |
| AllenCCF-Ontology-2017-8 | grey | Basic cell groups and regions | #BFDAE3 | 1.0 | MBA:8 | 191 | 218 | 227 | MBA:997 | 597 | 449681182 | 449.681182 |
| AllenCCF-Ontology-2017-315 | Isocortex | Isocortex | #70FF71 | 5.0 | MBA:315 | 112 | 255 | 113 | MBA:695 | 241 | 123282624 | 123.282624 |
| AllenCCF-Ontology-2017-184 | FRP | Frontal pole, cerebral cortex | #268F45 | 6.0 | MBA:184 | 38 | 143 | 69 | MBA:315 | 5 | 973876 | 0.973876 |
| AllenCCF-Ontology-2017-68 | FRP1 | Frontal pole, layer 1 | #268F45 | 7.0 | MBA:68 | 38 | 143 | 69 | MBA:184 | 1 | 256520 | 0.256520 |
# validate that term with the same acronym have the same number of voxels
alist = np.unique(term_with_counts['acronym'])
for aa in alist :
    filtered = term_with_counts[term_with_counts['acronym'] == aa]
    vlist = np.unique(filtered['voxel_count'])
    if len(vlist) > 1:
        print(aa, vlist)
The dataframe term_with_counts is available in the cache as parcellation_term_with_counts.
Visualizing parcellation annotation at each hierachy level#
We can explore the relationship and distribution of parcellations between term sets by creating a pivot table using pandas groupby fuunction. Each row of the resulting dataframe represents a parcellation, each column represents a term set and the value in the table is the name of the term that has been associated with the cluster for that specific term set.
pivot = parcellation_annotation.groupby(['parcellation_index','parcellation_term_set_name'])['parcellation_term_acronym'].first().unstack()
pivot = pivot[parcellation_term_set['name']] # order columns
pivot
| parcellation_term_set_name | organ | category | division | structure | substructure |
|---|---|---|---|---|---|
| parcellation_index | |||||
| 0 | unassigned | unassigned | unassigned | unassigned | unassigned |
| 1 | brain | grey | HY | TMv | TMv |
| 2 | brain | grey | Isocortex | SSp-m | SSp-m6b |
| 5 | brain | fiber tracts | lfbs | cst | int |
| 6 | brain | grey | P | PSV | PSV |
| ... | ... | ... | ... | ... | ... |
| 1323 | brain | grey | MB | IPN | IPI |
| 1324 | brain | grey | MB | IPN | IPDM |
| 1325 | brain | grey | MB | IPN | IPDL |
| 1326 | brain | grey | MB | IPN | IPRL |
| 1327 | brain | grey | MB | PAG | Su3 |
688 rows × 5 columns
name = parcellation_annotation.groupby(['parcellation_index', 'parcellation_term_set_name'])['parcellation_term_name'].first().unstack()
name = name[parcellation_term_set['name']] # order columns
name
| parcellation_term_set_name | organ | category | division | structure | substructure |
|---|---|---|---|---|---|
| parcellation_index | |||||
| 0 | unassigned | unassigned | unassigned | unassigned | unassigned |
| 1 | brain | Basic cell groups and regions | Hypothalamus | Tuberomammillary nucleus, ventral part | Tuberomammillary nucleus, ventral part |
| 2 | brain | Basic cell groups and regions | Isocortex | Primary somatosensory area, mouth | Primary somatosensory area, mouth, layer 6b |
| 5 | brain | fiber tracts | lateral forebrain bundle system | corticospinal tract | internal capsule |
| 6 | brain | Basic cell groups and regions | Pons | Principal sensory nucleus of the trigeminal | Principal sensory nucleus of the trigeminal |
| ... | ... | ... | ... | ... | ... |
| 1323 | brain | Basic cell groups and regions | Midbrain | Interpeduncular nucleus | Interpeduncular nucleus, intermediate |
| 1324 | brain | Basic cell groups and regions | Midbrain | Interpeduncular nucleus | Interpeduncular nucleus, dorsomedial |
| 1325 | brain | Basic cell groups and regions | Midbrain | Interpeduncular nucleus | Interpeduncular nucleus, dorsolateral |
| 1326 | brain | Basic cell groups and regions | Midbrain | Interpeduncular nucleus | Interpeduncular nucleus, rostrolateral |
| 1327 | brain | Basic cell groups and regions | Midbrain | Periaqueductal gray | Supraoculomotor periaqueductal gray |
688 rows × 5 columns
We can also obtain parcellation term color pivot tables in the same way
color = parcellation_annotation.groupby(['parcellation_index', 'parcellation_term_set_name'])['color_hex_triplet'].first().unstack()
color = color[parcellation_term_set['name']] # order columns
color.columns = ['%s_color' % x for x in color.columns]
color
| organ_color | category_color | division_color | structure_color | substructure_color | |
|---|---|---|---|---|---|
| parcellation_index | |||||
| 0 | #000000 | #000000 | #000000 | #000000 | #000000 |
| 1 | #FFFFFF | #BFDAE3 | #E64438 | #FF4C3E | #FF4C3E |
| 2 | #FFFFFF | #BFDAE3 | #70FF71 | #188064 | #188064 |
| 5 | #FFFFFF | #CCCCCC | #CCCCCC | #CCCCCC | #CCCCCC |
| 6 | #FFFFFF | #BFDAE3 | #FF9B88 | #FFAE6F | #FFAE6F |
| ... | ... | ... | ... | ... | ... |
| 1323 | #FFFFFF | #BFDAE3 | #FF64FF | #FFA6FF | #FFA6FF |
| 1324 | #FFFFFF | #BFDAE3 | #FF64FF | #FFA6FF | #FFA6FF |
| 1325 | #FFFFFF | #BFDAE3 | #FF64FF | #FFA6FF | #FFA6FF |
| 1326 | #FFFFFF | #BFDAE3 | #FF64FF | #FFA6FF | #FFA6FF |
| 1327 | #FFFFFF | #BFDAE3 | #FF64FF | #FF90FF | #FF90FF |
688 rows × 5 columns
channels = {}
for c in ['red', 'blue', 'green'] :
    df = parcellation_annotation.groupby(['parcellation_index', 'parcellation_term_set_name'])[c].first().unstack()
    df = df[parcellation_term_set['name']] # order columns
    df.columns = ['%s' % (x) for x in color.columns]
    channels[c] = df
channels['red']
| organ_color | category_color | division_color | structure_color | substructure_color | |
|---|---|---|---|---|---|
| parcellation_index | |||||
| 0 | 0 | 0 | 0 | 0 | 0 |
| 1 | 255 | 191 | 230 | 255 | 255 |
| 2 | 255 | 191 | 112 | 24 | 24 |
| 5 | 255 | 204 | 204 | 204 | 204 |
| 6 | 255 | 191 | 255 | 255 | 255 |
| ... | ... | ... | ... | ... | ... |
| 1323 | 255 | 191 | 255 | 255 | 255 |
| 1324 | 255 | 191 | 255 | 255 | 255 |
| 1325 | 255 | 191 | 255 | 255 | 255 |
| 1326 | 255 | 191 | 255 | 255 | 255 |
| 1327 | 255 | 191 | 255 | 255 | 255 |
688 rows × 5 columns
The dataframes created here (pivot, name, color, channels) are stored in the cache as parcellation_to_parcellation_term_membership_acronym, parcellation_to_parcellation_term_membership_name, parcellation_to_parcellation_term_membership_color, and parcellation_to_parcellation_term_membership_<channel>.
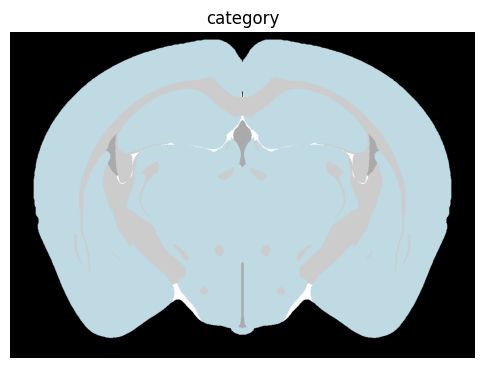
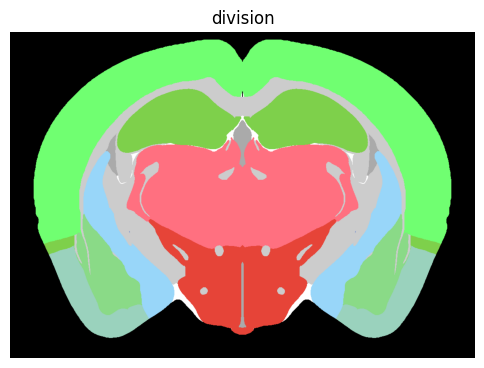
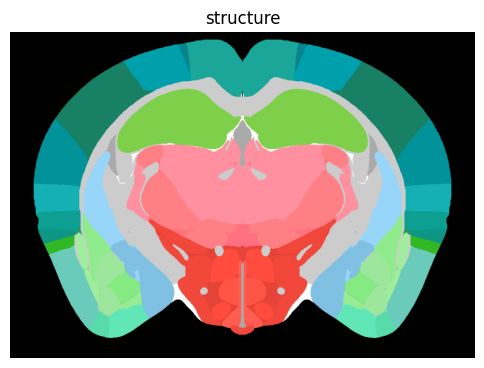
We define a helper function to colorized parcellation by its reference atlas color for each anatomical level
def colorize(zslice, term_set):

    # create a 3d array to store rgb image
    sshape = zslice.shape
    colorized = np.zeros((sshape[0], sshape[1], 3), dtype=np.uint8)

    for i,c in enumerate(['red', 'green', 'blue']):
        temp = np.zeros((sshape[0], sshape[1]), dtype=np.uint8)
        temp.flat[:] = channels[c].loc[zslice.flat[:], '%s_color' % term_set]
        colorized[:, :, i] = temp

    return colorized
zindex = 720
zslice = np.transpose(annotation_array[:, :, zindex])
fig, ax = plot_section(zslice)
res = ax.set_title('annotation_10')
plt.show()

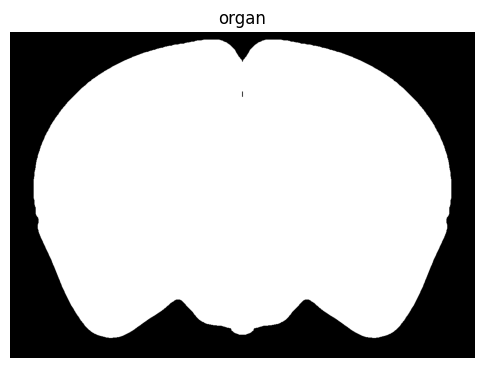
term_set = 'organ'
colorized = colorize(zslice, term_set)
fig, ax = plot_section(colorized)
res = ax.set_title(term_set)
plt.show()
term_set = 'category'
colorized = colorize(zslice, term_set)
fig, ax = plot_section(colorized)
res = ax.set_title(term_set)
plt.show()
term_set = 'division'
colorized = colorize(zslice, term_set)
fig, ax = plot_section(colorized)
res = ax.set_title(term_set)
plt.show()
term_set = 'structure'
colorized = colorize(zslice, term_set)
fig, ax = plot_section(colorized)
res = ax.set_title(term_set)
plt.show()
term_set = 'substructure'
colorized = colorize(zslice, term_set)
fig, ax = plot_section(colorized)
res = ax.set_title(term_set)
plt.show()
