Cell type neighborhood gallery#
In this notebook, we will visualize a set of cell type neighborhoods to produce visualizations similar to Figure 2 of Yao et al.
import pandas as pd
import numpy as np
import matplotlib.pyplot as plt
from pathlib import Path

from abc_atlas_access.abc_atlas_cache.abc_project_cache import AbcProjectCache
We will interact with the data using the AbcProjectCache. This cache object tracks which data has been downloaded and serves the path to the requsted data on disk. For metadata, the cache can also directly serve a up a Pandas Dataframe. See the getting_started notebook for more details on using the cache including installing it if it has not already been.
Change the download_base variable to where you have downloaded the data in your system.
download_base = Path('../../data/abc_atlas')
abc_cache = AbcProjectCache.from_cache_dir(download_base)

abc_cache.current_manifest
'releases/20250531/manifest.json'
Read in the list of neighborhood spatial embedding maps
maps = abc_cache.get_metadata_dataframe(directory='WMB-neighborhoods', file_name='dimension_reduction')
maps.set_index('name', inplace=True)
print("number of maps:", len(maps))
maps
dimension_reduction.csv: 100%|██████████| 1.68k/1.68k [00:00<00:00, 26.0kMB/s]
number of maps: 8
| label | description | number_of_cells | cluster_group_label | |
|---|---|---|---|---|
| name | ||||
| HY-EA-Glut-GABA | UMAP20230830-HY-EA-Glut-GABA | Glutamatergic and GABAergic neurons in hypotha... | 295448 | CCN20230722_HY-EA-Glut-GABA |
| MB-HB-CB-GABA | UMAP20230830-MB-HB-CB-GABA | GABAergic neurons in midbrain, hindbrain, and ... | 186775 | CCN20230722_MB-HB-CB-GABA |
| MB-HB-Glut-Sero-Dopa | UMAP20230830-MB-HB-Glut-Sero-Dopa | Glutamatergic, serotonergic and dopaminergic n... | 180669 | CCN20230722_MB-HB-Glut-Sero-Dopa |
| NN-IMN-GC | UMAP20230830-NN-IMN-GC | Non-neuronal cells, immature neurons, granule ... | 1418529 | CCN20230722_NN-IMN-GC |
| Pallium-Glut | UMAP20230830-Pallium-Glut | Glutamatergic neurons from cerebral cortex (de... | 1494801 | CCN20230722_Pallium-Glut |
| Subpallium-GABA | UMAP20230830-Subpallium-GABA | Telencephalic GABAergic neurons from cerebral ... | 611423 | CCN20230722_Subpallium-GABA |
| TH-EPI-Glut | UMAP20230830-TH-EPI-Glut | Glutamatergic neurons from thalamus and epitha... | 126171 | CCN20230722_TH-EPI-Glut |
| WholeBrain | UMAP20230830-WholeBrain | All cells in the whole mouse brain (5322 clust... | 4042976 | CCN20230722_WholeBrain |
Read in the extended 10x and MERFISH cell metadata created in the cluster neighborhood tutorial
cell_10x = abc_cache.get_metadata_dataframe(
    directory='WMB-neighborhoods',
    file_name='10x_cell_metadata_with_group_membership',
    dtype={"neurotransmitter": str}
)
cell_10x.set_index('cell_label', inplace=True)
print("number of 10x cells:", len(cell_10x))
10x_cell_metadata_with_group_membership.csv: 100%|██████████| 1.57G/1.57G [02:59<00:00, 8.74MMB/s]
number of 10x cells: 4042976
cell_merfish = abc_cache.get_metadata_dataframe(
    directory='WMB-neighborhoods',
    file_name='merfish_cell_metadata_with_group_membership',
    dtype={"cell_label": str, "neurotransmitter": str}
)
cell_merfish.set_index('cell_label', inplace=True)
print("number of merfish cells:", len(cell_merfish))
merfish_cell_metadata_with_group_membership.csv: 100%|██████████| 1.20G/1.20G [02:40<00:00, 7.49MMB/s]
number of merfish cells: 3938808
Create a set of helper functions to read in the neighborhood specific UMAP coordinates and to plot cells in a UMAP or anatomical context and apply them a set of neighborhood
def fetch_coord(group) :
    mlabel = maps.loc[group, 'label']
    coord = abc_cache.get_metadata_dataframe(
        directory='WMB-neighborhoods',
        file_name=mlabel
    )
    coord.set_index('cell_label', inplace=True)
    return coord
def plot_umap(xx, yy, cc=None, val=None, fig_width = 8, fig_height = 8, cmap=None):

    fig, ax = plt.subplots()
    fig.set_size_inches(fig_width, fig_height)

    if cmap is not None:
        plt.scatter(xx, yy, s=0.5, c=val, marker='.', cmap=cmap)
    elif cc is not None:
        plt.scatter(xx, yy, s=0.5, color=cc, marker='.')

    ax.axis('equal')
    ax.set_xlim(-18, 27)
    ax.set_ylim(-18, 27)
    ax.set_xticks([])
    ax.set_yticks([])

    return fig, ax
def plot_sections(df, group, feature, blist, fig_width = 20, fig_height = 5):

    fig, ax = plt.subplots(1, len(blist))
    fig.set_size_inches(fig_width, fig_height)

    for idx, bsl in enumerate(blist):

        filtered = df[df['brain_section_label'] == bsl].copy()
        filtered.sort_values(group, ascending=True, inplace=True)

        xx = filtered['x']
        yy = filtered['y']

        vv = filtered[feature].copy()
        pred = (filtered[group] == False)
        vv[pred] = '#f5f5f5'

        ax[idx].scatter(xx, yy, s=1.0, color=vv, marker=".")

        ax[idx].axis('equal')
        ax[idx].set_xlim(0, 11)
        ax[idx].set_ylim(11, 0)
        ax[idx].set_xticks([])
        ax[idx].set_yticks([])

        ax[idx].set_title("%s: %s" % (group, bsl))


    plt.subplots_adjust(wspace=0.01, hspace=0.01)
    plt.show()
    return fig, ax
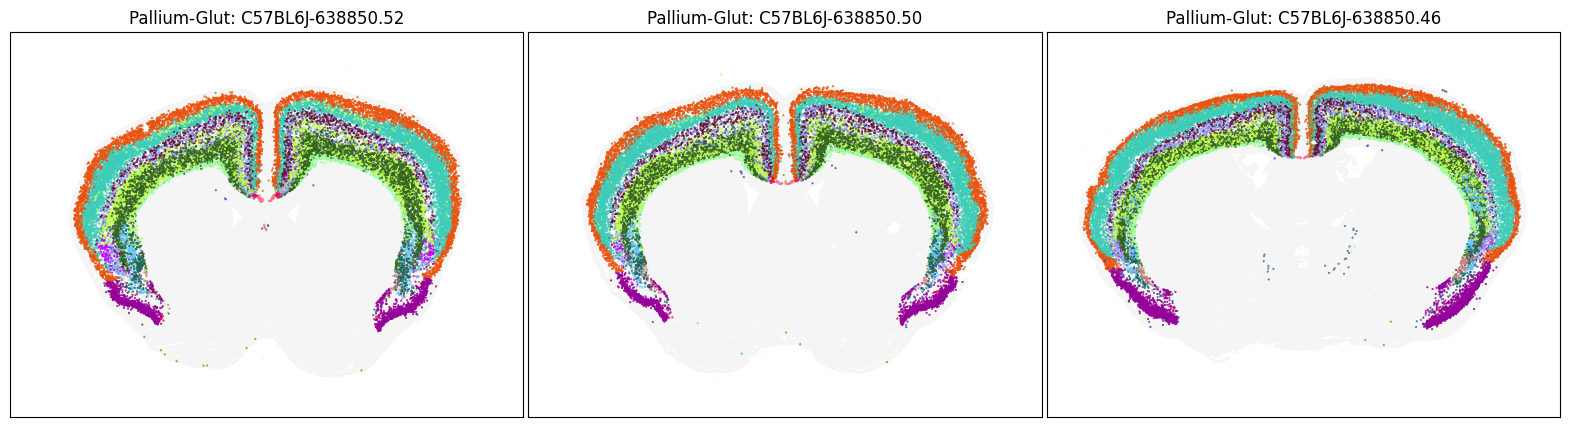
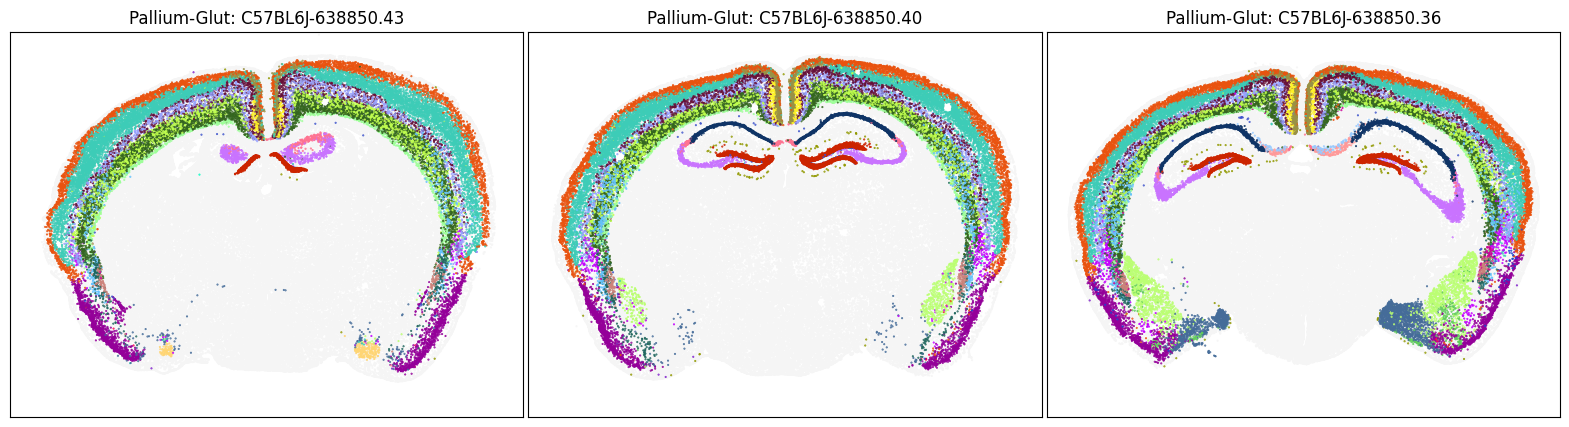
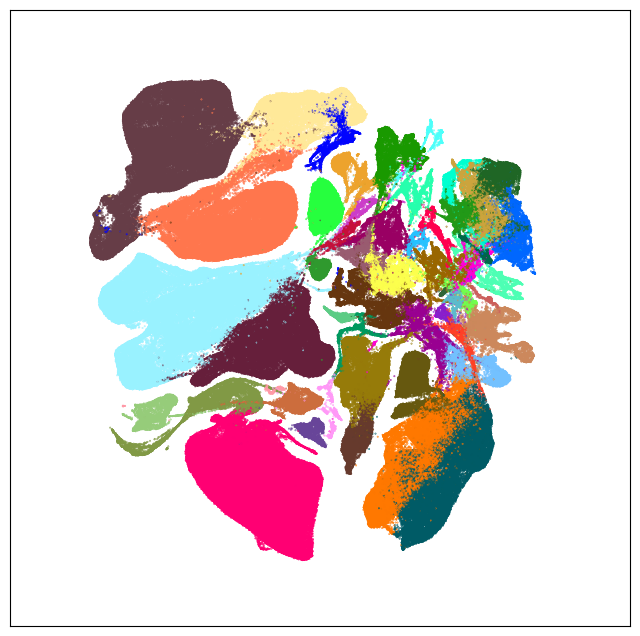
Neighborhood: Pallium-Glut#
group = 'Pallium-Glut'
coord = fetch_coord(group)
fig, ax = plot_umap(coord['x'], coord['y'], cc=cell_10x.loc[coord.index, 'subclass_color'])
plt.show()
UMAP20230830-Pallium-Glut.csv: 100%|██████████| 84.5M/84.5M [00:08<00:00, 9.52MMB/s]
blist = ['C57BL6J-638850.52', 'C57BL6J-638850.50', 'C57BL6J-638850.46']
fig, ax = plot_sections(cell_merfish, group, 'subclass_color', blist)
plt.show()
blist = ['C57BL6J-638850.43', 'C57BL6J-638850.40', 'C57BL6J-638850.36']
fig, ax = plot_sections(cell_merfish, group, 'subclass_color', blist)
plt.show()
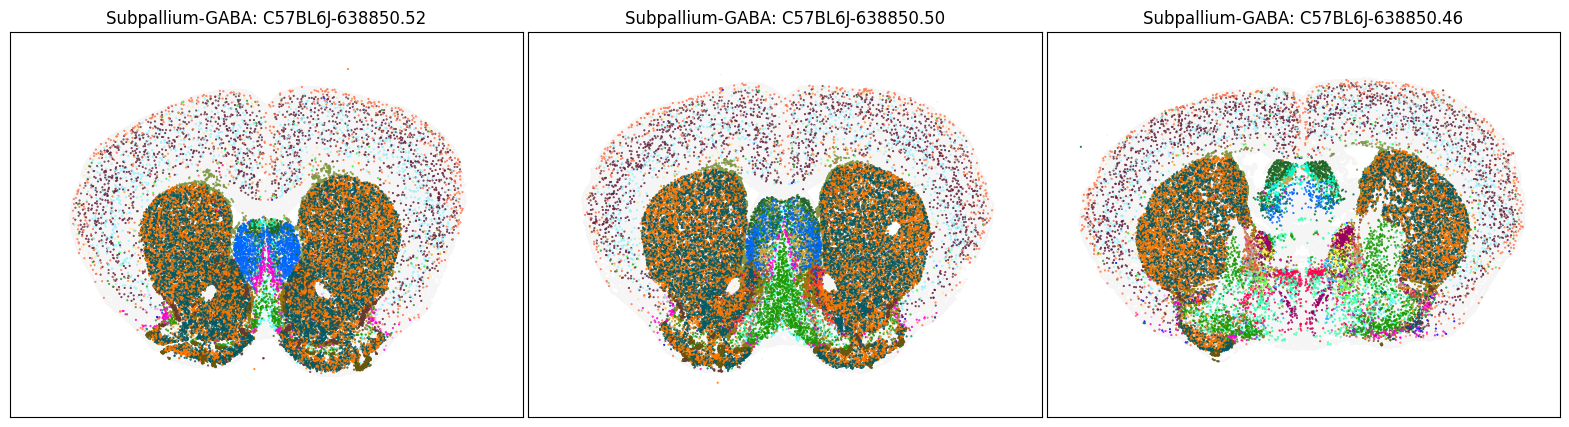
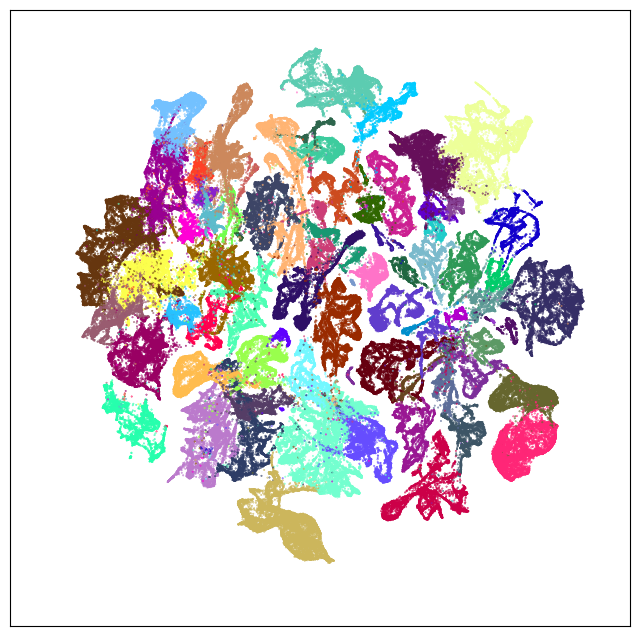
Neighborhood: Subpallium-GABA#
group = 'Subpallium-GABA'
coord = fetch_coord(group)
fig, ax = plot_umap(coord['x'], coord['y'], cc=cell_10x.loc[coord.index, 'subclass_color'])
plt.show()
UMAP20230830-Subpallium-GABA.csv: 100%|██████████| 27.7M/27.7M [01:08<00:00, 401kMB/s]
blist = ['C57BL6J-638850.52', 'C57BL6J-638850.50', 'C57BL6J-638850.46']
fig, ax = plot_sections(cell_merfish, group, 'subclass_color', blist)
plt.show()
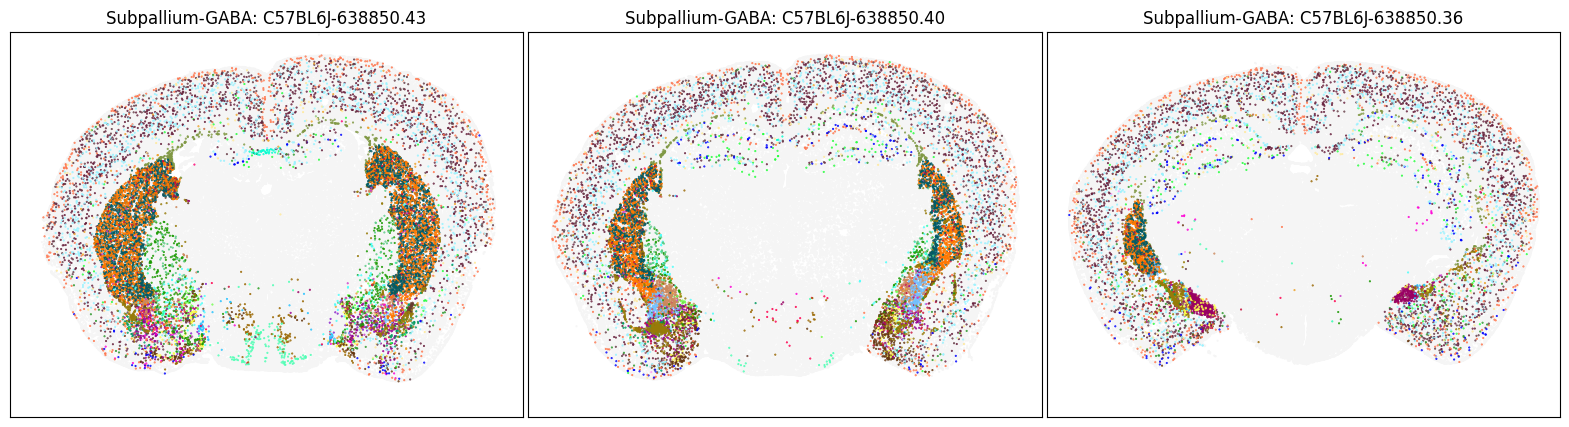
blist = ['C57BL6J-638850.43', 'C57BL6J-638850.40', 'C57BL6J-638850.36']
fig, ax = plot_sections(cell_merfish, group, 'subclass_color', blist)
plt.show()
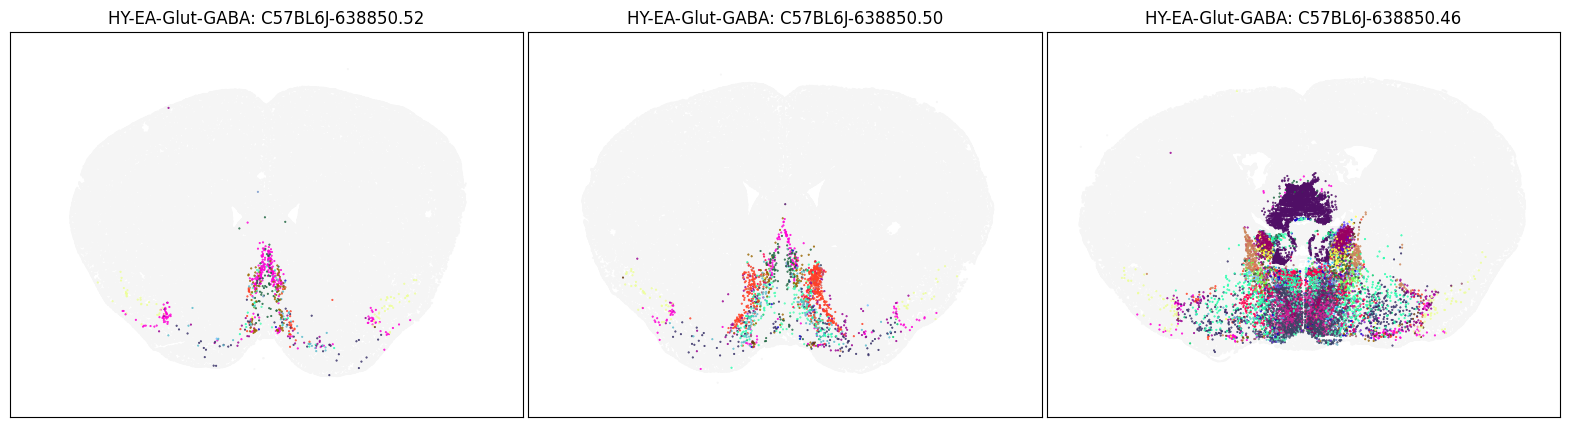
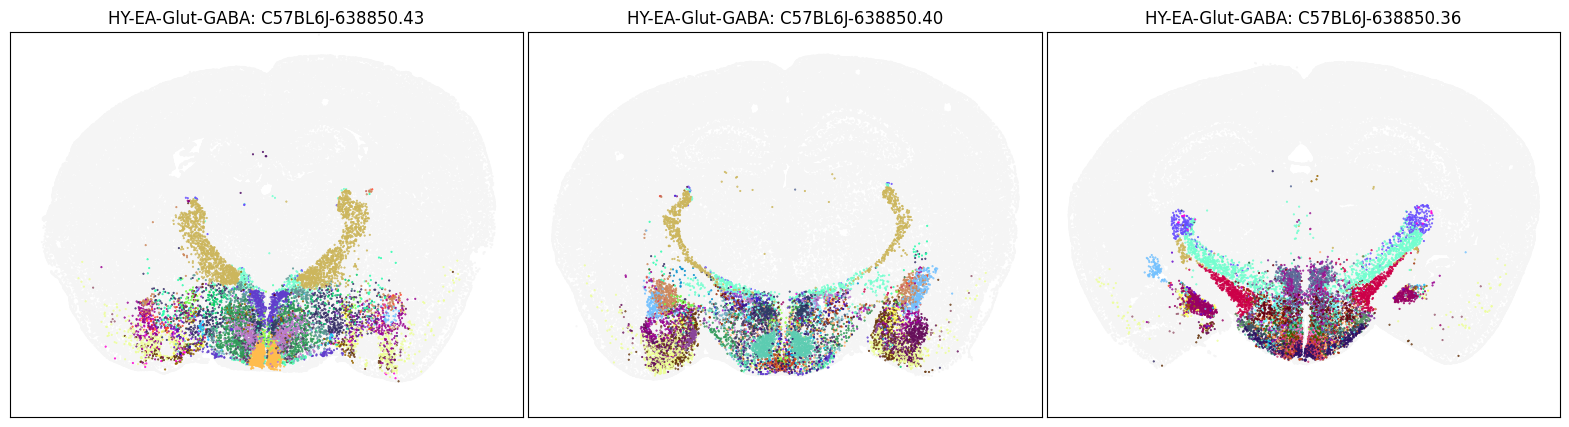
Neighborhood: HY-EA-Glut-GABA#
group = 'HY-EA-Glut-GABA'
coord = fetch_coord(group)
fig, ax = plot_umap(coord['x'], coord['y'], cc=cell_10x.loc[coord.index, 'subclass_color'])
plt.show()
blist = ['C57BL6J-638850.52', 'C57BL6J-638850.50', 'C57BL6J-638850.46']
fig, ax = plot_sections(cell_merfish, group, 'subclass_color', blist)
plt.show()
blist = ['C57BL6J-638850.43', 'C57BL6J-638850.40', 'C57BL6J-638850.36']
fig, ax = plot_sections(cell_merfish, group, 'subclass_color', blist)
plt.show()
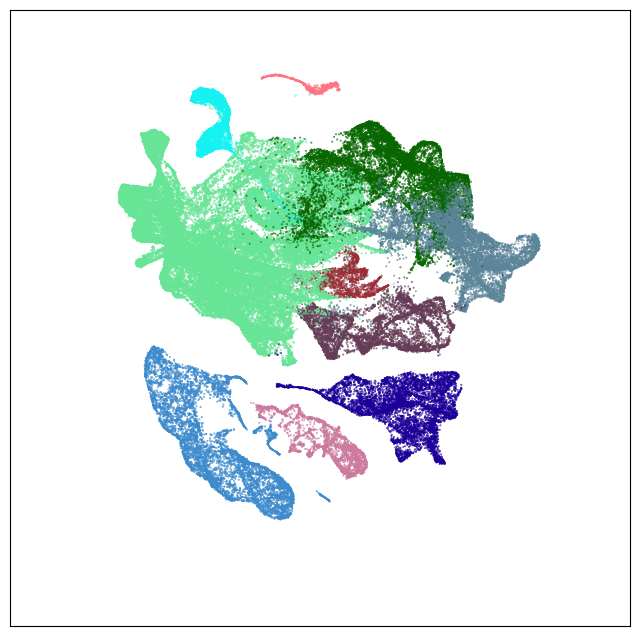
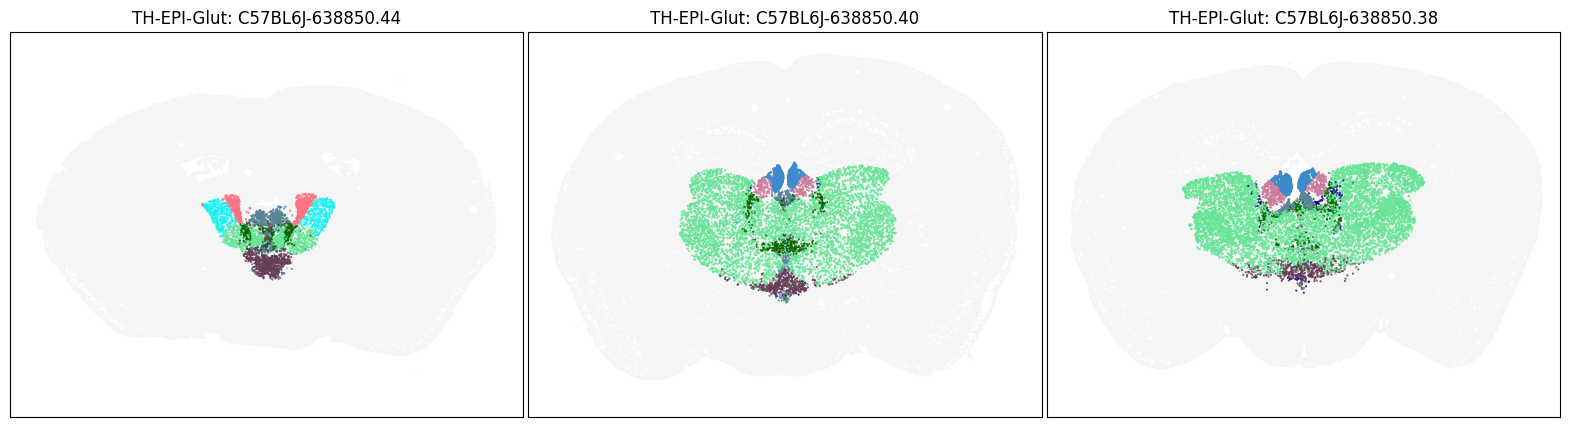
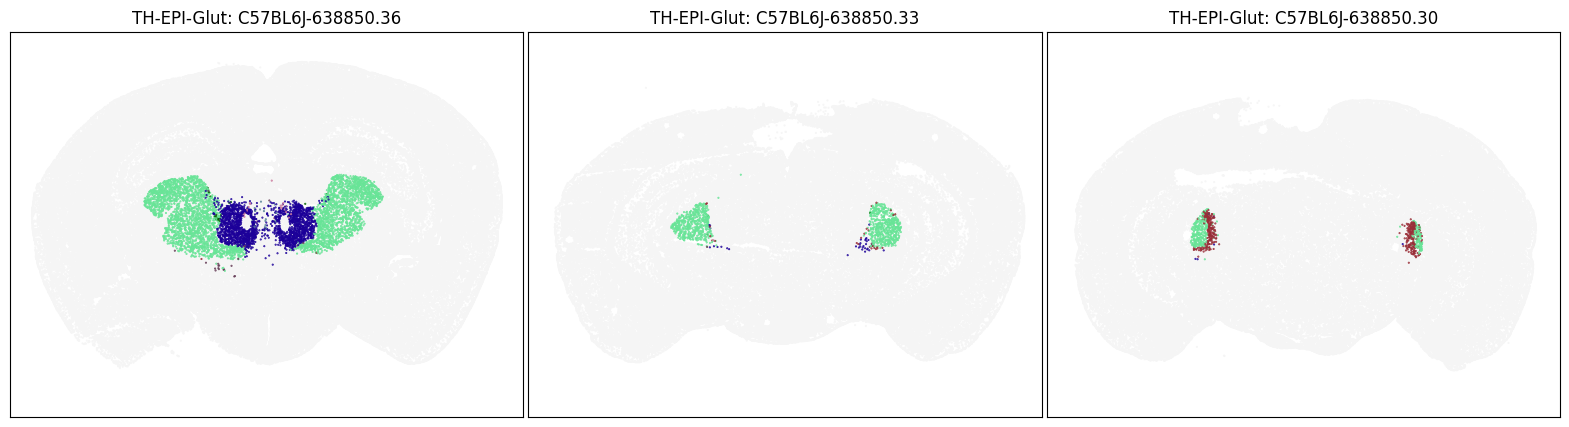
Neighborhood: TH-EPI-Glut#
group = 'TH-EPI-Glut'
coord = fetch_coord(group)
fig, ax = plot_umap(coord['x'], coord['y'], cc=cell_10x.loc[coord.index, 'subclass_color'])
plt.show()
blist = ['C57BL6J-638850.44', 'C57BL6J-638850.40', 'C57BL6J-638850.38']
fig, ax = plot_sections(cell_merfish, group, 'subclass_color', blist)
plt.show()
blist = ['C57BL6J-638850.36', 'C57BL6J-638850.33', 'C57BL6J-638850.30']
fig, ax = plot_sections(cell_merfish, group, 'subclass_color', blist)
plt.show()
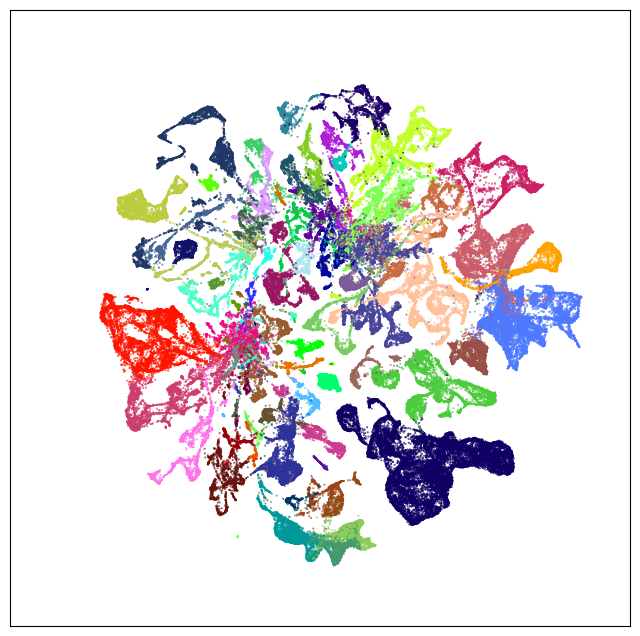
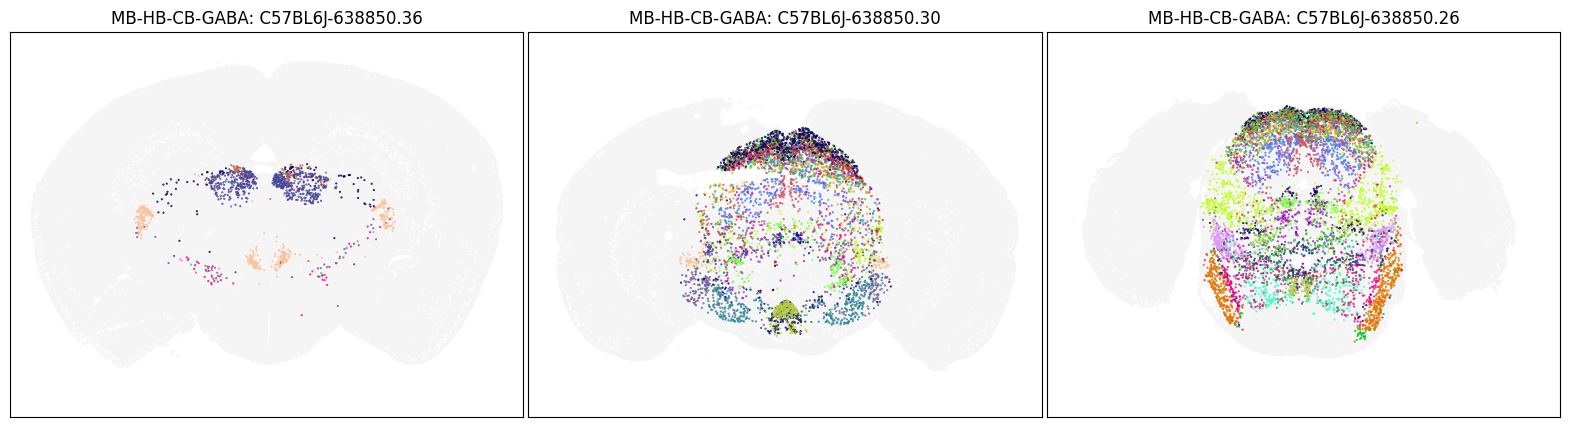
Neighborhood: MB-HB-CB-GABA#
group = 'MB-HB-CB-GABA'
coord = fetch_coord(group)
fig, ax = plot_umap(coord['x'], coord['y'], cc=cell_10x.loc[coord.index, 'subclass_color'])
plt.show()
UMAP20230830-MB-HB-CB-GABA.csv: 100%|██████████| 9.32M/9.32M [00:00<00:00, 11.6MMB/s]
blist = ['C57BL6J-638850.36', 'C57BL6J-638850.30', 'C57BL6J-638850.26']
fig, ax = plot_sections(cell_merfish, group, 'subclass_color', blist)
plt.show()
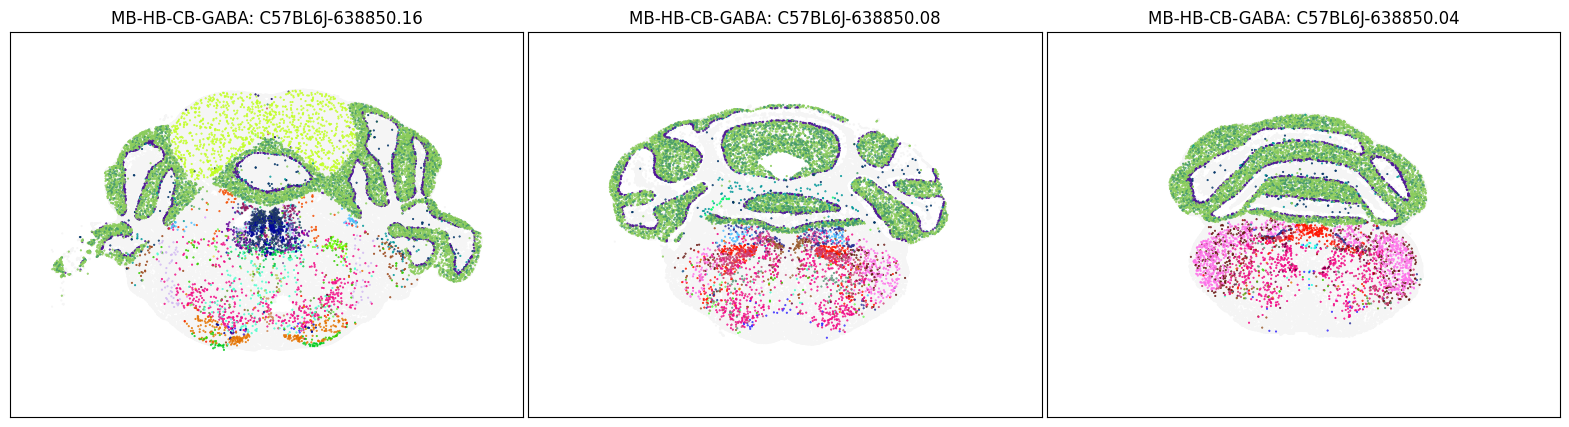
blist = ['C57BL6J-638850.16', 'C57BL6J-638850.08', 'C57BL6J-638850.04']
fig, ax = plot_sections(cell_merfish, group, 'subclass_color', blist)
plt.show()
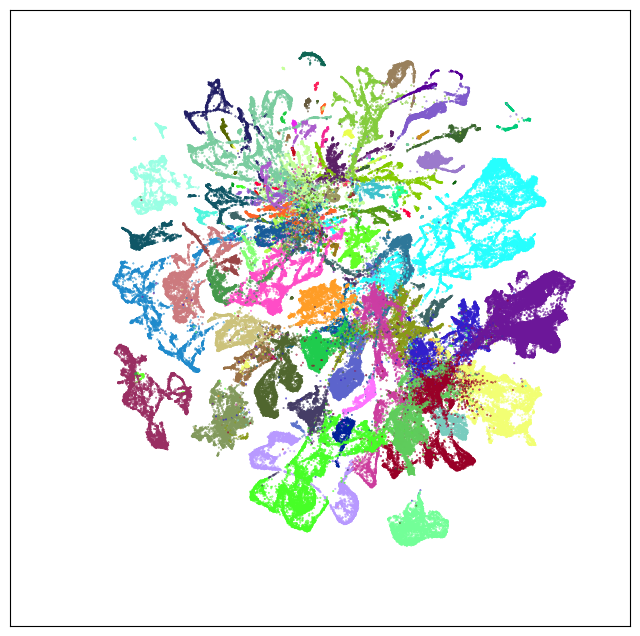
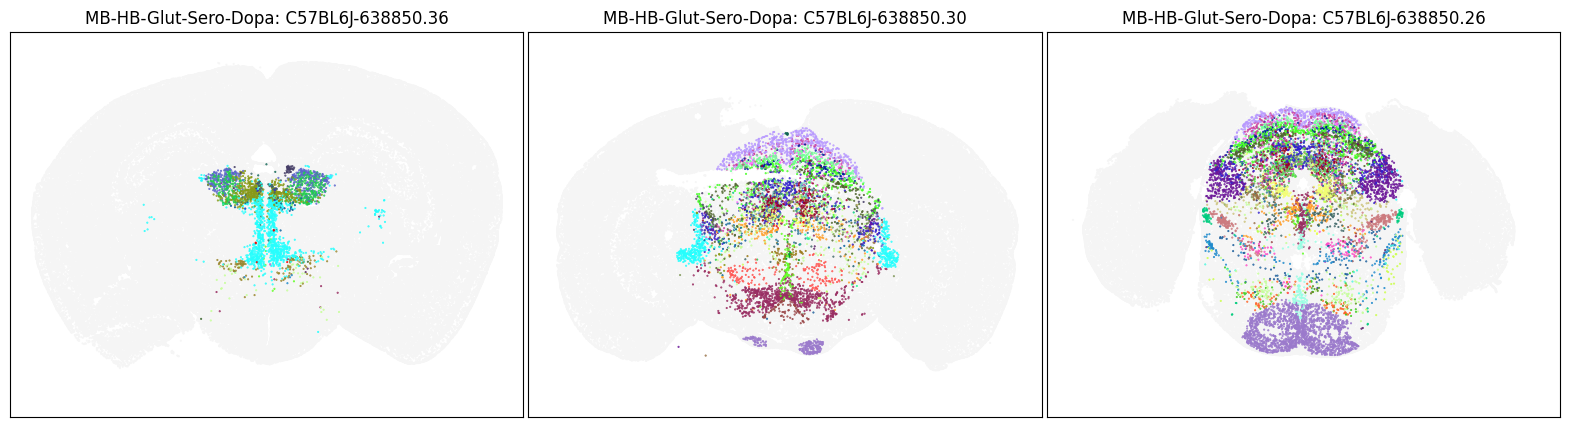
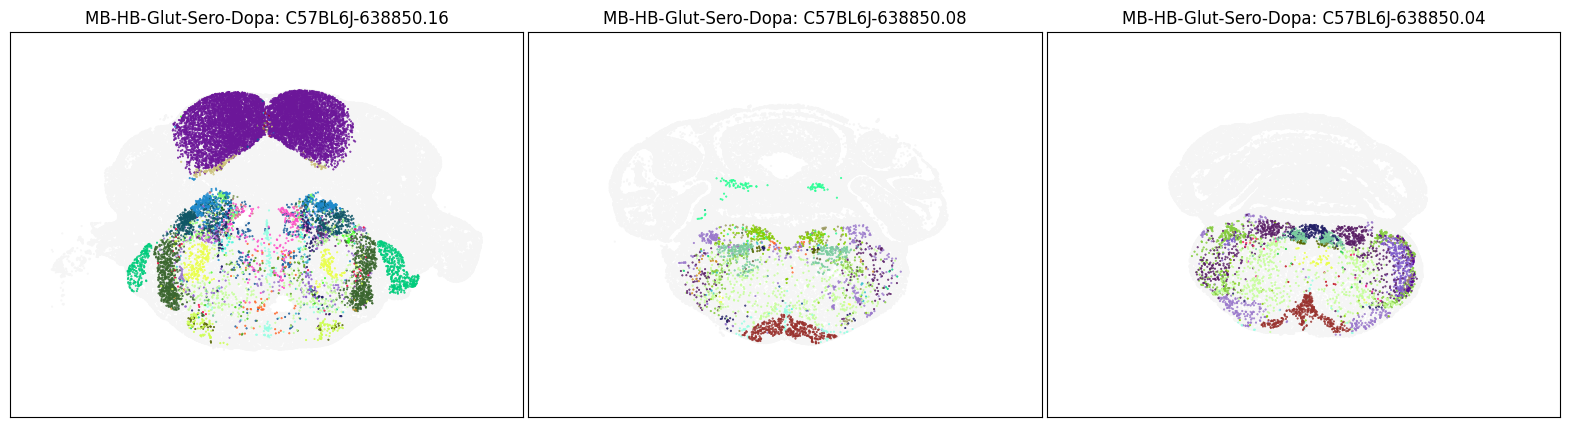
Neighborhood: MB-HB-Glut-Sero-Dopa#
group = 'MB-HB-Glut-Sero-Dopa'
coord = fetch_coord(group)
fig, ax = plot_umap(coord['x'], coord['y'], cc=cell_10x.loc[coord.index, 'subclass_color'])
plt.show()
UMAP20230830-MB-HB-Glut-Sero-Dopa.csv: 100%|██████████| 8.42M/8.42M [00:00<00:00, 8.78MMB/s]
blist = ['C57BL6J-638850.36', 'C57BL6J-638850.30', 'C57BL6J-638850.26']
fig, ax = plot_sections(cell_merfish, group, 'subclass_color', blist)
plt.show()
blist = ['C57BL6J-638850.16', 'C57BL6J-638850.08', 'C57BL6J-638850.04']
fig, ax = plot_sections(cell_merfish, group, 'subclass_color', blist)
plt.show()
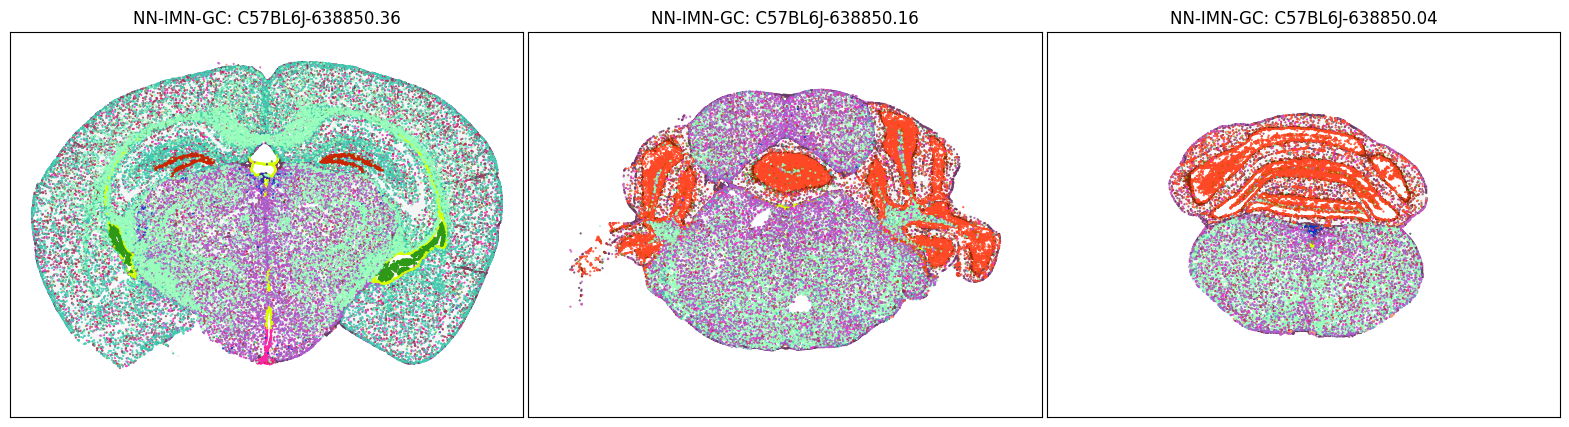
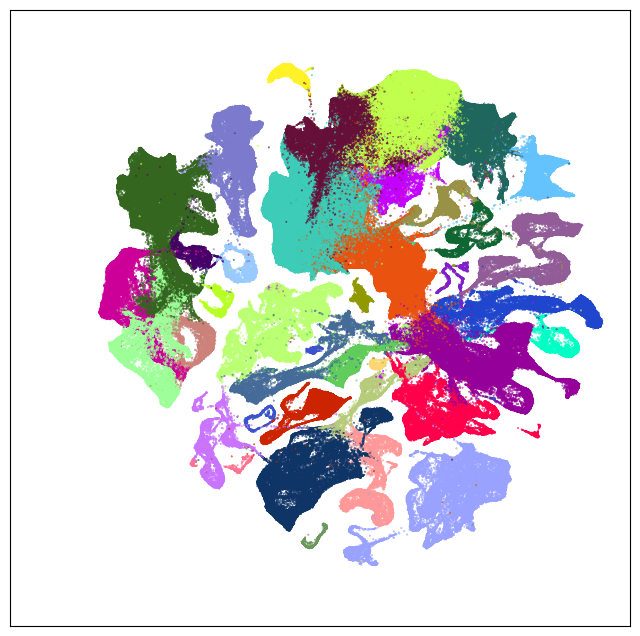
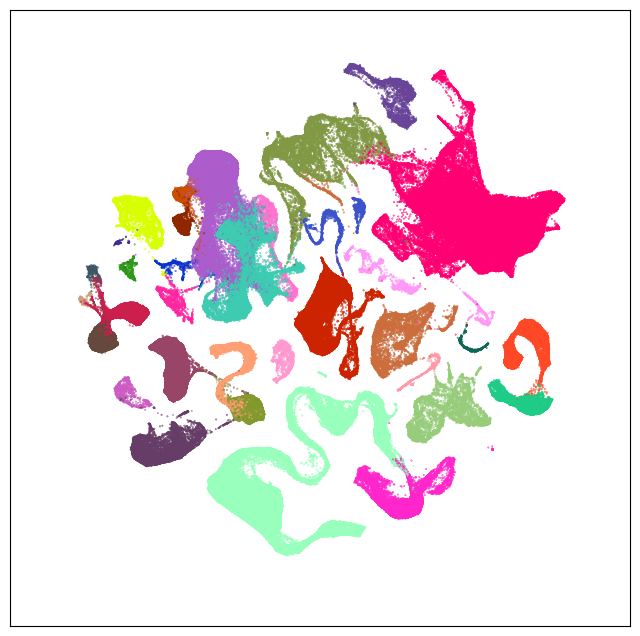
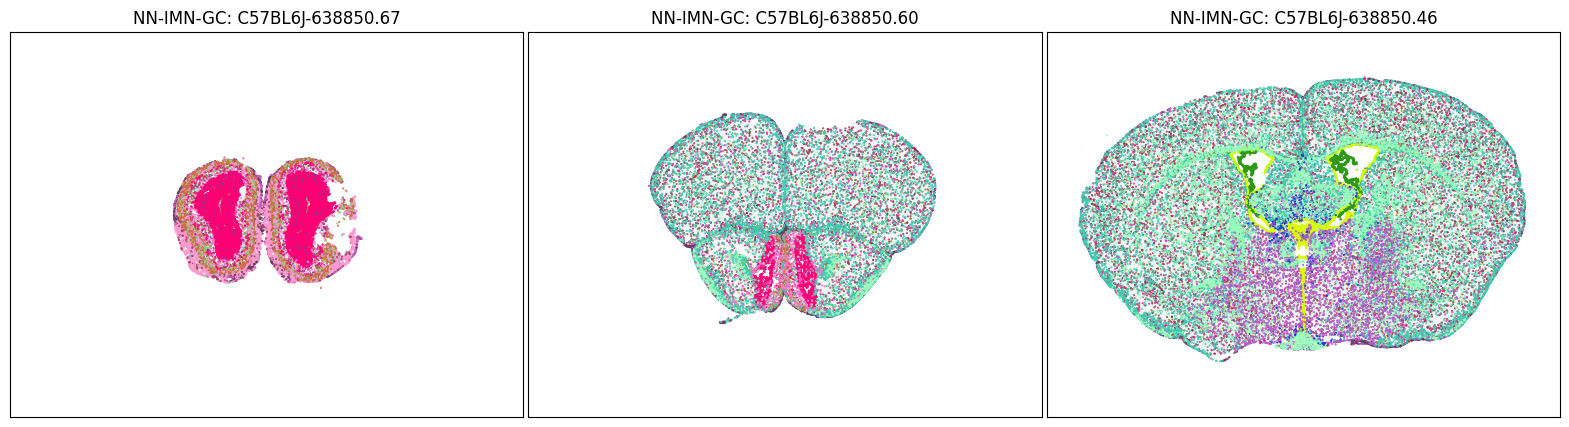
Neighborhood: NN-IMN-GC#
group = 'NN-IMN-GC'
coord = fetch_coord(group)
fig, ax = plot_umap(coord['x'], coord['y'], cc=cell_10x.loc[coord.index, 'subclass_color'])
plt.show()
UMAP20230830-NN-IMN-GC.csv: 100%|██████████| 83.4M/83.4M [00:08<00:00, 10.2MMB/s]
blist = ['C57BL6J-638850.67','C57BL6J-638850.60','C57BL6J-638850.46']
fig, ax = plot_sections(cell_merfish, group, 'subclass_color', blist)
plt.show()
blist = ['C57BL6J-638850.36', 'C57BL6J-638850.16', 'C57BL6J-638850.04']
fig, ax = plot_sections(cell_merfish, group, 'subclass_color', blist)
plt.show()