DataBrowser
The DataBrowser allows the user to view acquired sweeps and metadata during and after an experiment. It has several display modes that facilitate recording from multiple headstages simultaneously. Users may also manipulate and analyze (automatically backed up) data using a built-in custom scripting language that includes general and specialized electrophysiology functions see The Sweep Formula Module.
The following figure shows the DataBrowser with all three subpanels. The main graph to the top right visualizes the currently selected sweep(s), either via the controls in Sweep Control or via Overlay Sweeps. The controls on the left, Settings, tune the display behaviour, and the remaining tabs allow more fine-grained and specialized control for visualization and data evaluation. See the corresponding sub-pages at the top of this page. The bottom most panel, Settings History, allows to visualize labnotebook entries.
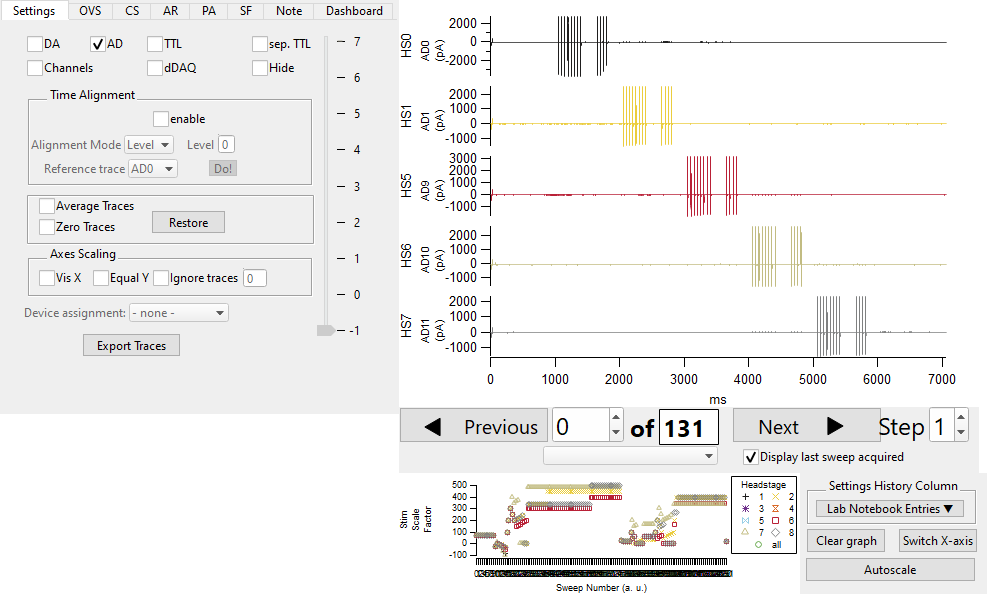
DataBrowser with all subwindows
For better readability we have a fixed color scheme for the acquired data, most notably the headstages.
Relevant Colors
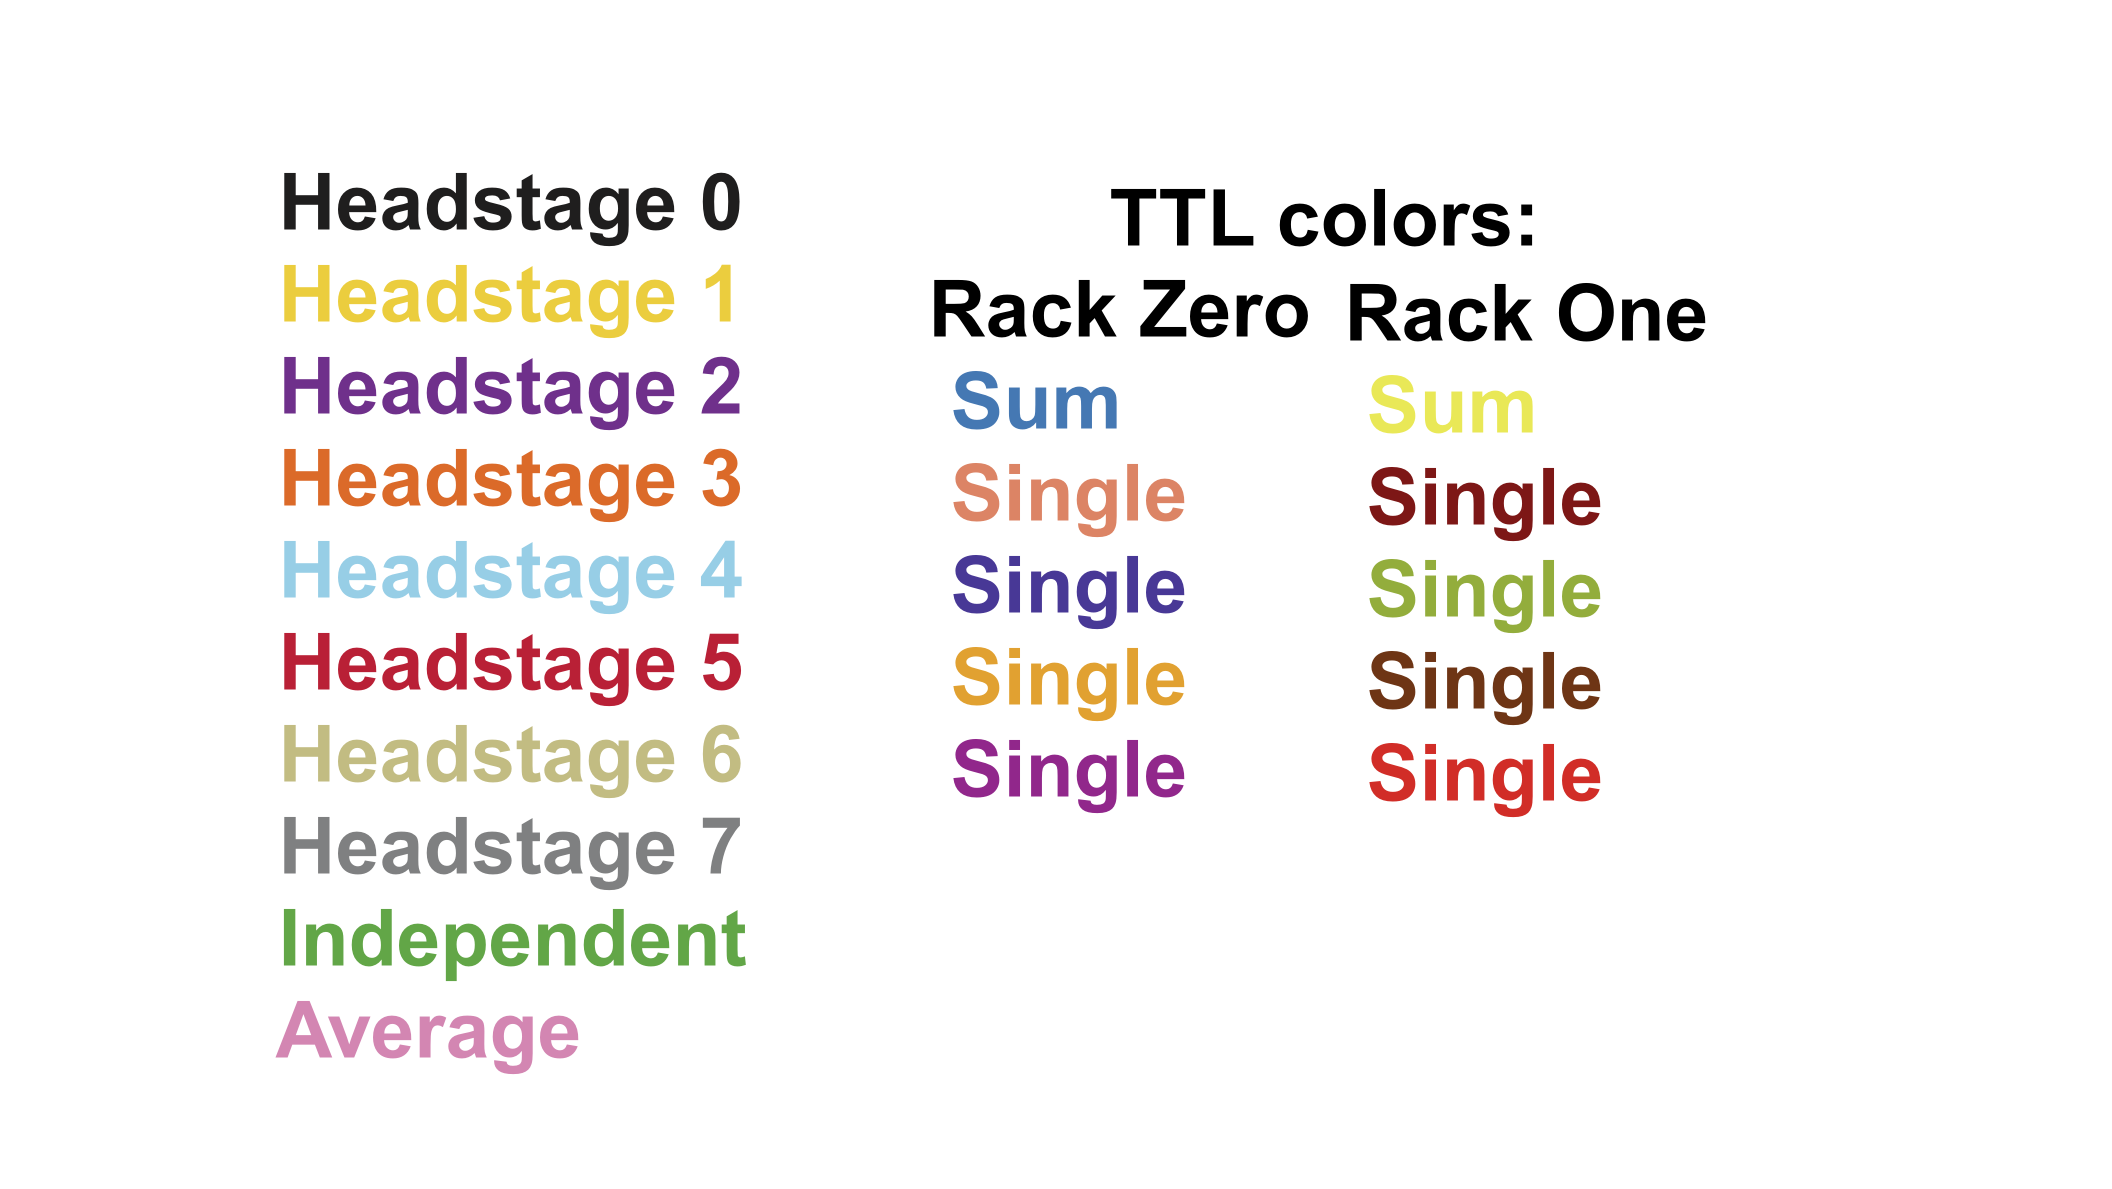
Color scheme used throughout the DataBrowser and other panels which display headstage and channel dependent information
SweepBrowser vs DataBrowser
We only speak about the DataBrowser here, but nearly everything also applies to the SweepBrowser. Exceptions are mentioned explicitly.
The DataBrowser is used when viewing sweeps during acquisition and when they are from the currently open Igor Pro experiment. The SweepBrowser is started from the AnalysisBrowser and can be used to browse acquired sweeps loaded from PXP and NWB files.