SweepFormula PSC/PSP classification
Algorithm
The algorithm for finding psc/psp events can be summarized as follows:
The deconvolution kernel is created by the psxKernel operation using the rise/decay tau and an amplitude
Sweep data is zeroed, filtered using a bandpass filter and then deconvoluted with the kernel
With the number of standard deviations passed to psx we then calculate the peak threshold in the deconvoluted data
This peak threshold is then used to find the events in the deconvoluted data this gives deconvPeak and deoconvPeak_t
Throw away events which have an amplitude with different sign as the kernel amplitude
Calculate peak and peak_t via taking the maximum (positive kernel amp sign) or minimum (negative kernel amp sign) in the range of [deconvPeak_t – kernelRiseTau or devonvPeak_t of the previous event (whichever comes later), deconvPeak_t + 0.33 * kernelDecayTau or deconvPeak_t of the next event (which ever comes first)] in the filtered sweep wave
Calculate baseline and baseline_t via maximum (negative kernel amp sign) or minimum (positive kernel amp sign) in the range of [peak_t – 10 * kernelRiseTau, peak_t], averaged over +/- 5 points, in the filtered sweep wave
iei is the time difference between two events’ peak_t values
tau and the fit result values are calculated from an exponential fit
Calculate Slew Rate and Slew Rate Time via taking the maximum (positive kernel amp sign) or minimum (negative kernel amp sign) in the range of [peak_t, baseline_t]
Calculate Onset Time using the y level crossing at differential threshold percentage from psxRiseTime of the difference between the Slew Rate and filteered sweep data at baseline_t
Calculate Rise Time by finding the two level crossings, lower and upper thresholds from psxRiseTime in the range Onset Time to peak_t corrected by invertred kernel amplitude sign
GUI
When using the psx SweepFormula operation the normal graphing is enhanced by various additional graphs and user interface options. The following graph shows the layout for a psx and psxStats operation with real acquired data.
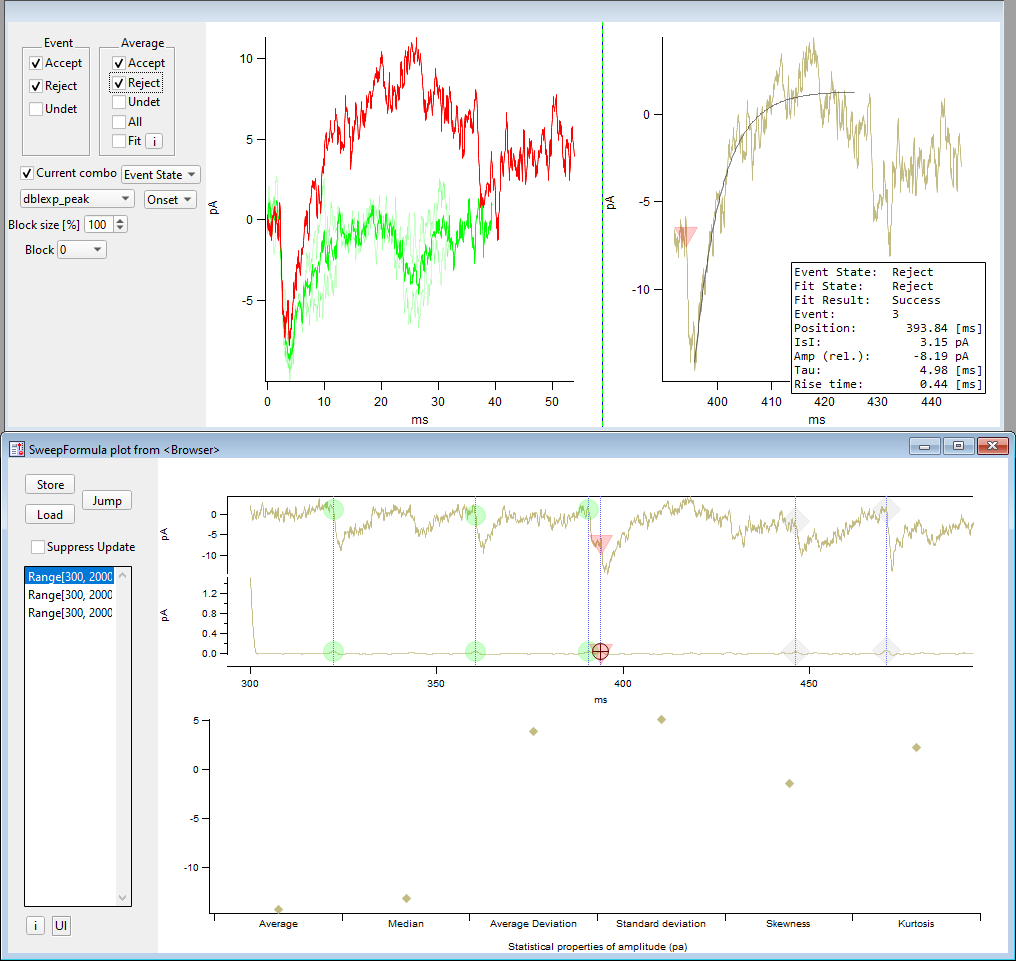
SweepFormula PSX GUI
The main panel SweepFormula plot from <Browser> has a left vertical column
with UI controls, the psx graph at the top and a psxstats graph at the bottom.
Above the main panel are again some UI controls on the very left, the all event graph and then the single event graph at the very right.
Main panel
Left UI controls
Store: Store the event properties including the classification results (Event StateandFit State) in the results waves using theidas key and JSON as serialization format.Load: Load the event properties from the results wave using the currently activeidJump: Jump to the next event having event state undetermined, also changes the combination if required.Suppress Update: Avoid updating the top all and single event graphs on event/fit state and/or cursor changes.ListBox: The combinations listbox has an entry for every combination ofrangeandselectwhere psx found at least one event. The psx graph only ever plots one combination, and therefore one can choose the to-be-plotted combination here.i: Button to copy the psx/psxkernel/psxRiseTime input parameters to the clipboardUI: Hover over this element with the mouse to learn about the keyboard shortcuts
psx
The psx graph represents the results of the event search and is split vertically into two graphs. The top one shows the filtered and offsetted sweep data, the lower one in addition the deconvolution with the input from psxkernel.
All found events are marked initially as undetermined for the Event/Fit state.
The Event state is visualized by colorized markers: a grey square for undetermined, a green circle for accept and a red triangle for reject.
With the A cursor a single event can be selected, properties of that event are
displayed in the single event graph (top right).
The following options exist to set the event and fit state of a single or multiple events:
Mouse Control
Toggle the state of a single event by pressing
CTRLand clicking on it with the left mouse buttonDraw a marquee and select one of following custom menu entries:
PSX: Accept Event & FitPSX: Reject Event & FitPSX: Accept FitPSX: Reject Fit
which operate on all events inside the marquee and perform the obvious thing.
The
PSX: Jump to Eventsentry is only useful inside the psxstats graph as it brings the events inside the marquee into view in the psx plot.
Keyboard Control
The following keyboard shortcuts work for either the psx or the psxstats
graphs. All of them require that the cursor A is located on an event, which
is by default the case for the psx graph. The current direction for automatic
advancement defaults to left-to-right.
↑(up): Accept the current event, changing both event and fit state to accept, and advance the cursor to the next event in the current direction↓(down): Reject the current event, changing both event and fit state to reject, and advance the cursor to the next event in the current direction→(right): Move the cursor to the next event on the right←(left): Move the cursor to the previous event on the left(space): Toggle the event and fit state of the current event without any movementr: Reverse the current directionc: Center the x-axis around the current evente: Toggle the event statef: Toggle the fit statez: Accept the event state but reject the fit state
psxstats
Visualizes properties of the given combinations. The marquee and the keyboard control options from the psx graph are also available.
Top Panel
Left UI controls
The combination to select the drawn single events and their averages from are
determined by the state of the Current combo checkbox. The state to use for
the selection, either fit or event state, is determined by the popup menu.
Accept: Show all accepted eventsReject: Show all rejected eventsUndetermined: Show all undetermined eventsAverage:Accept: Show all the average of all accepted eventsReject: Show all the average of all rejected eventsUndetermined: Show the average of all undetermined eventsAll: Show the average of all events regardless of the stateFit: Show the fit of the averaged events, the fit coefficients are alsostored in the results wave
i: Hover over this element with the mouse to view the average fit coefficients
Current combo: Restrict the event selection to the currently selected combination (checked) or use all of them (unchecked)Fit State/Event State: Select the state to use as basis for selectiondblexp_peak/dblexp_XOffset: Select the fit curve for the average fitOnset/Peak/Slew: Select the event property to offset the events in the all events graph toBlock size [%]: Percentage to select what part of the events are displayed in the all events graph. This can help with reducing the number of plotted events so that the interactive event classification in the all event graph is easier.Block: Block number to display in the all events graph in case a block size smaller than 100% was selected.
All event graph
The top left graph shows events and average selected by the UI controls to its left. The state can be changed by hovering the mouse over an event trace and pressing the keyboard shortcuts available for the psx graph.
Single event graph
The top right graph shows a single event including its fit (greyish line) which might
not be present as well. The shown event is selected by cursor A in the psx
graph. The textbox has various properties of the shown event.
No UI options are available for this graph.