Experimental sessions are conducted across multiple days on the same mouse. When imaging the brain location on the same plane with 2-Photon Imaging, the image will not be perfectly identical. The frame may be in a slightly different location on the brain or at a slightly different depth. Additionally, cells can move relative to each other over time. Due to this, computational methods are required to identify which cell Regions of Interest (ROIs) are the same as the previous session.
We use the Allen Institute’s Nway Matching pipeline for this which is described in more detail below.
Environment Setup
⚠️Note: If running on a new environment, run this cell once and then restart the kernel⚠️
import warnings
warnings.filterwarnings('ignore')

try:
    from databook_utils.dandi_utils import dandi_download_open
except:
    !git clone https://github.com/AllenInstitute/openscope_databook.git
    %cd openscope_databook
    %pip install -e .
import json
import os
import sys
import matplotlib.pyplot as plt
import numpy as np
from PIL import ImageDownloading Ophys NWB Files
Here you can download several files for a subject that you can run nway matching on. The pipeline can take in any number of input sessions, however, the input ophys data should be from the same imaging plane of the same subject. To specify your own file to use, set dandiset_id to be the dandiset id of the files you’re interested in. Also set input_dandi_filepaths to be a list of the filepaths on dandi of each file you’re interested in providing to Nway Matching. When accessing an embargoed dataset, set dandi_api_key to be your DANDI API key.
dandiset_id = "000336"
dandi_filepath_1 = "sub-621602/sub-621602_ses-1193555033-acq-1193675753_ophys.nwb"
dandi_filepath_2 = "sub-621602/sub-621602_ses-1194555869-acq-1194754135_ophys.nwb"
download_loc = "."

# some newer OpenScope files from Predictive Processing Community Project
# dandiset_id = "001768"
# dandi_filepath_1 = "sub-839909/sub-839909_ses-multiplane-ophys-839909-2026-02-20-12-53-27_ophys.nwb"
# dandi_filepath_2 = "sub-839909/sub-839909_ses-multiplane-ophys-839909-2026-02-26-15-11-01_ophys.nwb"

# here, specify the list dandi filepaths of the files you want to run cell matching on
# the subject ids should be the same, but the session ids should be different
input_dandi_filepaths = [dandi_filepath_1, dandi_filepath_2]
ios = [dandi_download_open(dandiset_id, filepath, download_loc) for filepath in input_dandi_filepaths]
nwbs = [io.read() for io in ios]PATH SIZE DONE DONE% CHECKSUM STATUS MESSAGE
sub-621602_ses-1193555033-acq-1193675753_ophys.nwb 169.1 MB 169.1 MB 100% ok done
Summary: 169.1 MB 169.1 MB 1 done
100.00%
Downloaded file to ./sub-621602_ses-1193555033-acq-1193675753_ophys.nwb
Opening file
PATH SIZE DONE DONE% CHECKSUM STATUS MESSAGE
sub-621602_ses-1194555869-acq-1194754135_ophys.nwb 159.1 MB 159.1 MB 100% ok done
Summary: 159.1 MB 159.1 MB 1 done
100.00%
Downloaded file to ./sub-621602_ses-1194555869-acq-1194754135_ophys.nwb
Opening file
# since newer OpenScope NWBs have all planes, specify one here if necessary
# set plane_name = None if using older NWBs (one file per plane)
# plane_name = 'VISp_1'
plane_name = None
### Helpers to fetch fields from NWB files, which can be in different locations/formats in older vs newer NWBs

if plane_name is not None:
    # use these for newer OpenScope NWBs (all planes in one file)
    def get_avg_image(nwb):
        return np.array(nwb.processing[plane_name]["images"]["average_projection"])

    def get_roi_table(nwb):
        return nwb.processing[plane_name]["image_segmentation"]["roi_table"]

    def get_depth(nwb):
        return nwb.imaging_planes[plane_name].location.split()[3]
else:
    # use these for older OpenScope NWBs (one file per imaging plane)
    def get_avg_image(nwb):
        return np.array(nwb.processing["ophys"]["images"]["average_image"])

    def get_roi_table(nwb):
        return nwb.processing["ophys"]["image_segmentation"]["cell_specimen_table"]

    def get_depth(nwb):
        return nwb.lab_meta_data["metadata"].imaging_depth

# nway matching expects an integer id for each NWB, so we'll invent some
nwb_ids = {nwb.identifier: i for i, nwb in enumerate(nwbs)}
def get_nwb_id(nwb):
    return nwb_ids[nwb.identifier]

# these should be similar values, indicating that the images are from the same imaging plane
for nwb in nwbs:
    print(get_depth(nwb))
309
309
Generating Cell-Matching Input File
The Allen Institute has created a robust pipeline for conducting cell matching between 2 or more sessions called Nway Matching. For those who are inquisitive, the general algorithm is described in page 31 of Garrett et al. (2023). In summary, the input images are aligned together with a euclidean image registration technique. Then the given input ROI masks are used with the Blossom Algorithm as a bipartite graph matching algorithm. This identifies which ROIs represent the same cells with high probability.
The caveat to using this pipeline is that it requires input in a specific JSON format rather than an NWB File. The following functions are used to generate a file, input.json, which can be used to obtain important output. The input json contains an entry for each input experiment. 2 or more experiments can be used. The first experiment is called fixed and the other ones are moving. For each experiment, a unique experiment ID, a path to the experiment projection image, and a list of objects for each ROI are required.
### for each ROI in an ROI table, create a JSON object containing its information, return a list of JSON objects
# id_offset ensures ROI IDs are globally unique across experiments (newer NWBs reuse IDs starting at 0)

def make_roi_entries(roi_table, id_offset=0):
    roi_entries = []
    for roi_idx in range(len(roi_table)):
        roi_entry = {
            "id": int(roi_table["id"][roi_idx]) + id_offset,
            "valid": True,
            "x": 0,
            "y": 0,
            "z": 1,
            "width": 512,
            "height": 512,
            # convert 2D array to 2D list of bools
            "mask_matrix": [[bool(elem) for elem in row] for row in roi_table["image_mask"][roi_idx]]
        }
        roi_entries.append(roi_entry)
    return roi_entries
### take in an image array and return it converted to uint16
def normalize_to_16b(image_array):
return image_array.astype(np.uint16)
def normalize_to_8b(image_array):
# Normalize the image to 0–255 and convert to uint8
image_array = np.array(image_array, dtype=np.float32)
image_array -= image_array.min()
if image_array.max() > 0:
image_array /= image_array.max()
image_array *= 255
return image_array.astype(np.uint8)### convert an nwb object into a 'experiment' JSON object with the required format
def nwb_to_experiment_json(nwb, id_offset=0):
# save image here
grayscale_image = get_avg_image(nwb)
image_array = normalize_to_8b(np.array(grayscale_image))
image_uint8 = np.clip(image_array, 0, 255).astype(np.uint8)
# Save using 'L' mode directly to avoid conversion errors
image_file = Image.fromarray(image_uint8, mode='L')
image_file.save(f"./{nwb.identifier}_image.png")
roi_table = get_roi_table(nwb)
experiment = {
"id": get_nwb_id(nwb),
"ophys_average_intensity_projection_image": f"./{nwb.identifier}_image.png",
"cell_rois": make_roi_entries(roi_table, id_offset)
}
return experiment### make the input json object, populate its experiments field with an experiment object for each nwb object
input_exps = {
"experiment_containers": {
"ophys_experiments": []
}
}
# use a cumulative offset to ensure ROI IDs are globally unique across experiments
id_offset = 0
for nwb in nwbs:
experiment = nwb_to_experiment_json(nwb, id_offset)
input_exps["experiment_containers"]["ophys_experiments"].append(experiment)
id_offset += len(get_roi_table(nwb))
with open("input.json", "w") as f:
json.dump(input_exps, f, indent=2)Running the Algorithm
Nway Matching can be run as a command with the following parameters. From there, several output files are generated.
res = !{sys.executable} -m nway.nway_matching --input_json input.json --output_json "./output.json" --output_dir matching_output

if not os.path.exists("output.json"):
    raise RuntimeError("output.json was not created!\nCommand output:\n" + "\n".join(res))
Showing Cell Matching Output
The cell matching pipeline outputs the data as a output JSON, and a few plots as .png images. The paths to the plots are fetched from the output JSON and displayed below. Additionally, the output json contains a list of matching ROI IDs from each image.
with open("output.json", "r") as f:
    output = json.load(f)
summary_plot = Image.open(output["nway_warp_summary_plot"])
fig, ax = plt.subplots(figsize=(10,10))
ax.imshow(summary_plot)
ax.axis("off")(-0.5, 560.5, 2951.5, -0.5)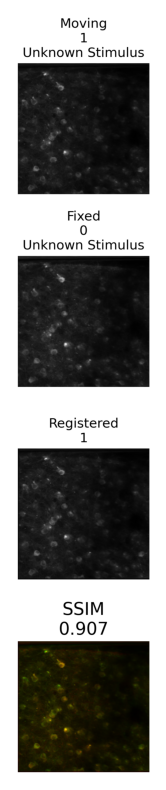
overlay_plot = Image.open(output["nway_warp_overlay_plot"])
fig, ax = plt.subplots(figsize=(10,10))
ax.axis("off")
ax.imshow(overlay_plot)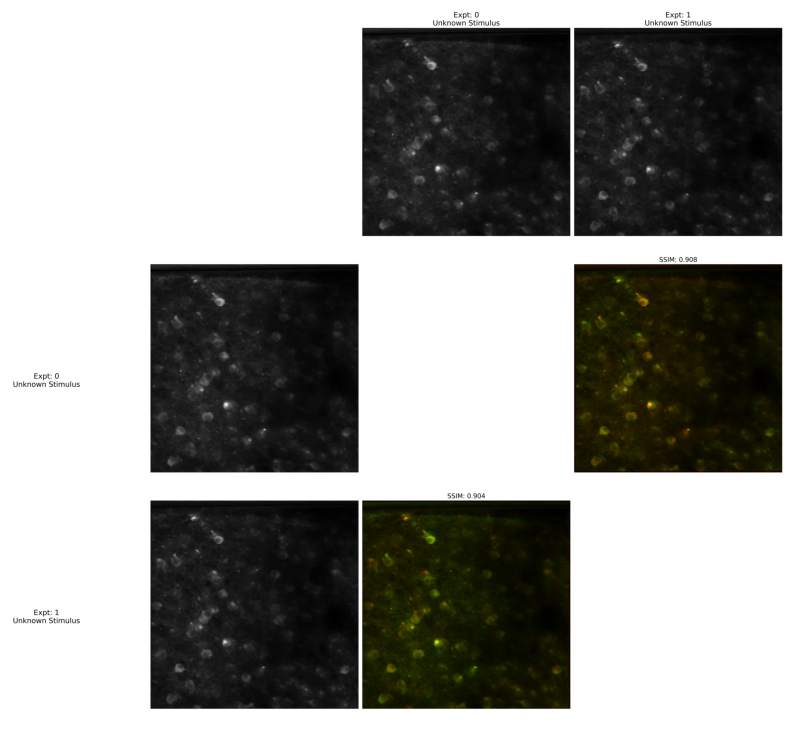
fraction_plot = Image.open(output["nway_match_fraction_plot"])
fig, ax = plt.subplots(figsize=(10,10))
ax.axis("off")
ax.imshow(fraction_plot)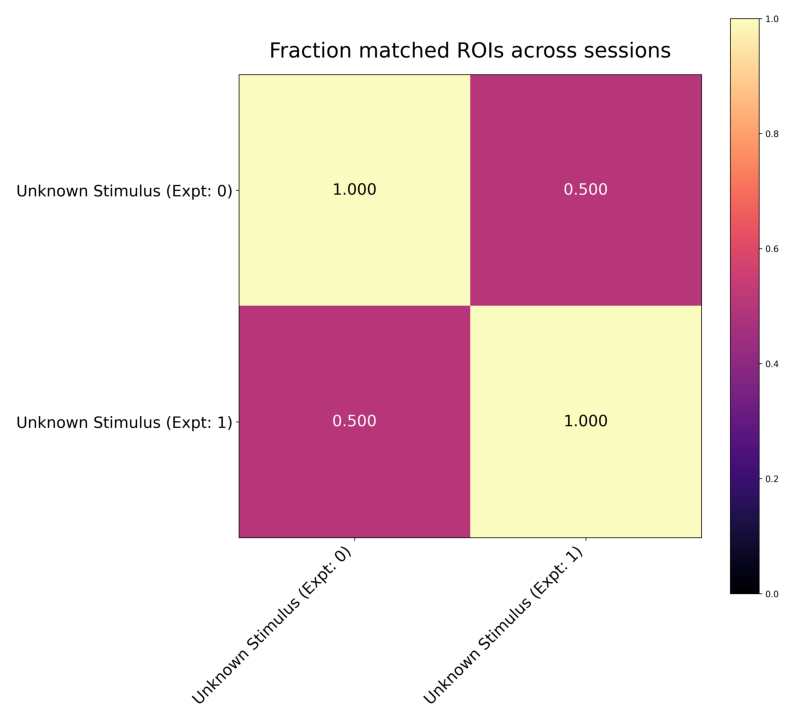
Visualizing Matching Cells
Apart from the image plots above, the main other part of the output is the nway_matches list, which contains a list of tuples the contain ROI IDs that match between session. The tuples are at most length n, where n is the number of experiments the Nway Matching pipeline was given, but some tuples will be shorter if a match wasn’t found. The code below uses these tuples of matching IDs, along with the ROI masks in each NWB file’s ROI tables, and generates n images that use color to show the matching ROIs between sessions.
# takes an ROI mask, colors it, adds it onto image
def add_color_mask(image, mask, color):
    black = [0,0,0]
    color_mask = np.array([[(color if boolean else black) for boolean in row] for row in mask])
    merged_image = np.where(color_mask!=black, color_mask, image)
    return merged_image
# generates a "random" color based on n
def gen_color(n):
return [n*270 % 255, n*610 % 255, n*890 % 255]# finds the table and image index that an ROI id belongs to
def get_image_num(id):
for i in range(len(nwbs)):
if id in roi_tables[i].index:
return i### for every match in the output, generate images which consist of ROI masks that supposedly match between sessions
# roi_tables correspond to images based on index of nwb in nwbs list
# reindex with the same global offsets used when building input.json
roi_tables = []
id_offset = 0
for nwb in nwbs:
df = get_roi_table(nwb).to_dataframe()
df.index = df.index + id_offset
roi_tables.append(df)
id_offset += len(df)
images = [np.zeros((512,512,3)).astype("uint8") for _ in nwbs]
nway_matches = output["nway_matches"]
# for every list of matching IDs, generate a color, and add the ROI masks with those IDs to their respective images
for i in range(len(nway_matches)):
match = nway_matches[i]
# unmatched ROIs will be shown white
if len(match) == 1:
color = [255,255,255]
else:
color = gen_color(i)
for id in match:
# n is the index of which image and which ROI table this ROI belongs to
n = get_image_num(id)
roi_table = roi_tables[n]
# casting mask entry from roi table into np array
mask = roi_table[roi_table.index==id].image_mask.to_numpy()[0]
# add mask to image with given color
images[n] = add_color_mask(images[n], mask, color)fig, axs = plt.subplots(len(images), figsize=(10,10))
for i in range(len(images)):
axs[i].imshow(images[i])
fig.suptitle("Matched ROIs between sessions\n(White ROIs are unmatched)")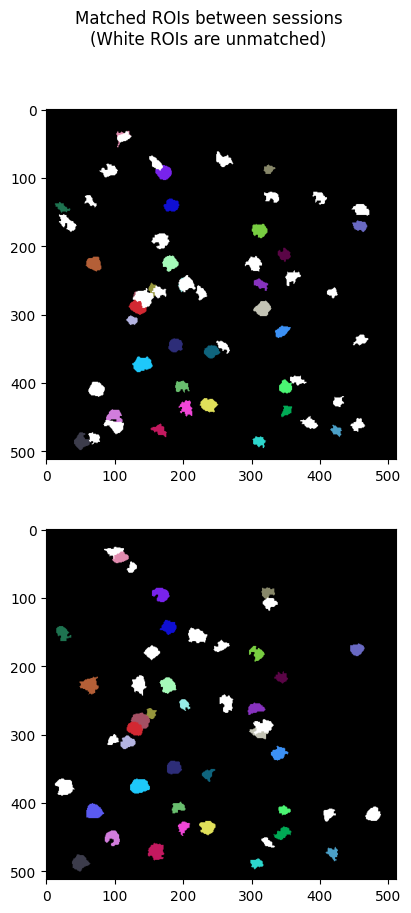
- Garrett, M., Groblewski, P., Piet, A., Ollerenshaw, D., Najafi, F., & Yavorska, I. (2023). Stimulus novelty uncovers coding diversity in visual cortical circuits. BioRxiv. 10.1101/2023.02.14.528085